As traders who observe footprint chart patterns, we are continuously collecting nuances that help us identify trade setups and the risks we take in these setups. In most cases, it is the confluence of clues that make up one good trade. Recently we have discussed how an Elite Trader on our trading floor executed big size using multiple tools such as footprint chart and technical pattern. In this article, we will be looking at a similar set of tools, but from a slightly different perspective. We will be using these market tools.
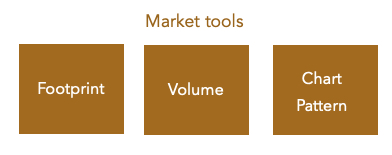
Specifically, we will look at:
- Bull flag – what clues to look for, when a flag is formed and how we should wait for appropriate timing to access the trade
- Footprint – what to look at the footprint chart in order to define meaningful risk-reward trade
We will use a breakout trade in Gold as demonstrated in the video down below in our example.
Bull Flag Technical Pattern
Starting with the bull flag technical pattern, we will first look at the basic principle that defines a bull flag. Let’s use this picture to describe the very basic parts forming a bull flag.
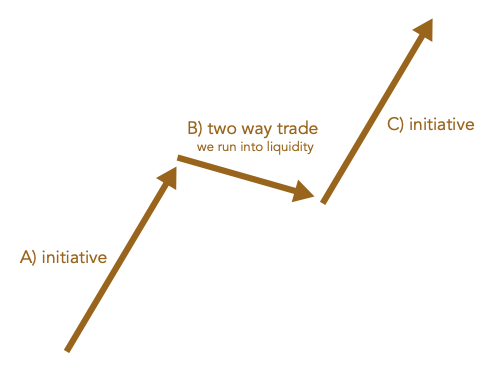
In other words, we have an initiative, in this case by buyers. Once the liquidity was found, we have a two-way trade followed by a change in dynamics and initiative taken again by the buyers. One of the ways, how you can read the nuances of the flag is to use the market profile as we have discussed in our previous post. You can also take different approach just by simply analyzing how each candle was formed and how long it took buyers and sellers to move prices.
Let’s have a look at our gold example:
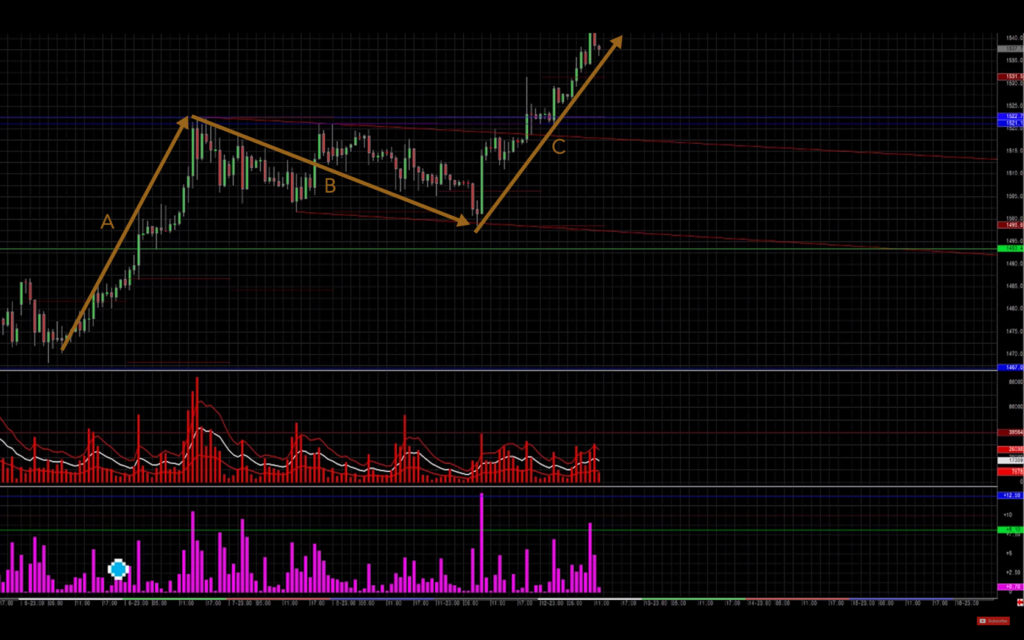
As you can see buyers moved prices much more quickly then sellers did. This can be one of the clues, that this flag has the potential to break and continue higher. Let’s define our clue:
Does that mean, that we should buy immediately because buyers are stronger than sellers in this particular instance? No, but it gives us a clue to build our narrative. One of the risks you are running with flags is “Harry the hindsight”. It is a very easy post flag break to say, where you “could” buy and make money. The problem is that, when a flag is forming, you need to wait for that exact point to define your risk and not getting in too early (pre-empting) with very hardly defined risk. In order for us to define a risk well, let’s use footprint, to look inside the breakout out of this flag to understand, how we could access this with well-defined risk.
Using Footprint Chart Patterns To Access The Trade
What we are specifically looking at with the breakout out of this flag is a way how to access the trade. We can notice how volume and range changed at 7:25PM relative to recent volume with 2000 contracts traded lifting the offers (marked as A on the image down below). In comparison to the previous volume, this is substantially higher volume, a signal that market dynamics are changing. This was followed by a retrace (marked B) where absorption happen and buyers reloaded. It was now clear, that buyers have shifted from being passive, to being more aggressive and we can enter the trade with much more clearly defined risk below the breakout rotation (A).
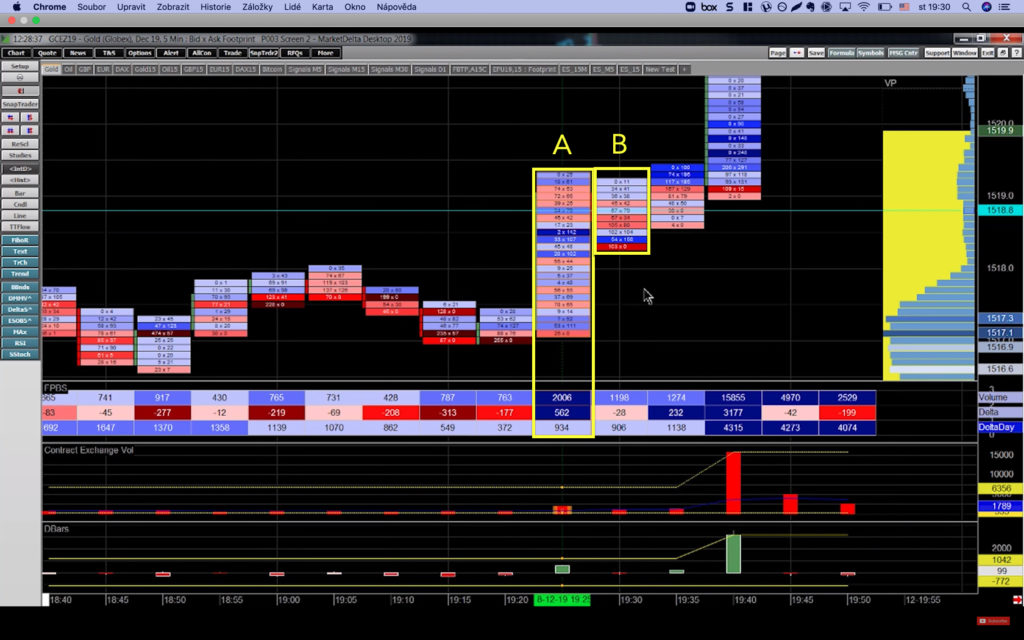
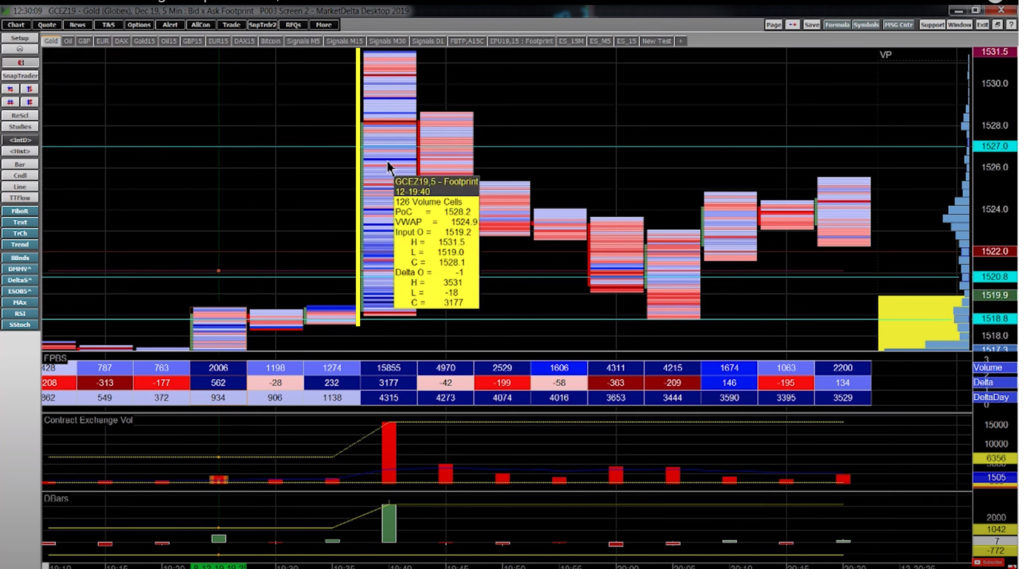
After we have found our access with well-defined risk, market lifted offers in the next 5-minute rotation and finally confirmed our trade idea with breaking out higher on nearly 16 000 contracts traded.
A combination of our understanding of how this flag was formed and a footprint chart to define the risk with much better precision can give us a much more clear idea on where and how to access the trade. Rather than entering blindly and in many cases too early, we were able to wait for the opportunity with much more favorable risk-reward.
In case you want to become an expert on how to read the footprint charts like those described above, consider checking our Footprint Trading Course.
Also, if you liked this article, you might check these as well:
- How to create and understand the Sierra Chart Footprint
- Price Ladder tactics managing big size
- How To Use Market Profiles In Your Morning Prep
Thanks for reading and until next time, trade well.
JK
Learn To Trade With The Footprint Tool & More
To learn to trade with the footprint chart and develop your career as an elite trader then check out our range of Trader Training courses. Our flagship 8 Week Career Programme can be attended live on our London Trading Floor or virtually from home as an online trading course. These are the most comprehensive training programmes in the proprietary futures trading industry and are based upon years of successful in-house skills development.
Axia Futures
4 Endsleigh Street London GB WC1H 0DS
+44 20 3880 8500
https://axiafutures.com/
Social Media:
Facebook: https://www.facebook.com/AXIAFutures/
YouTube: https://www.youtube.com/AxiaFutures
LinkedIn: https://www.linkedin.com/company/Axia-Futures/
Contacts:
Demetris Mavrommatis – Co-Founder, Head of Trading
Alex Haywood – Co-Founder Head of Strategy