In the previous article, we have looked at how Elite Axia trader executed big size in European equities market using tools such as Market profile, chart patterns, news, and trend. By breaking down each step of the way, we have identified repeatable trading patterns that helped this trader enter the trade with big conviction. Although trade entry is a very important part of being a consistently profitable trader, an equally critical part is also trade management using price ladder order-flow.
In this post, we will be looking at trade management as it was recorded in the second part of the video (starts at 18min and 25sec) and also we will add extra bits that were not covered in the video to gain clarity into what was going on just before the trader entered the trade.
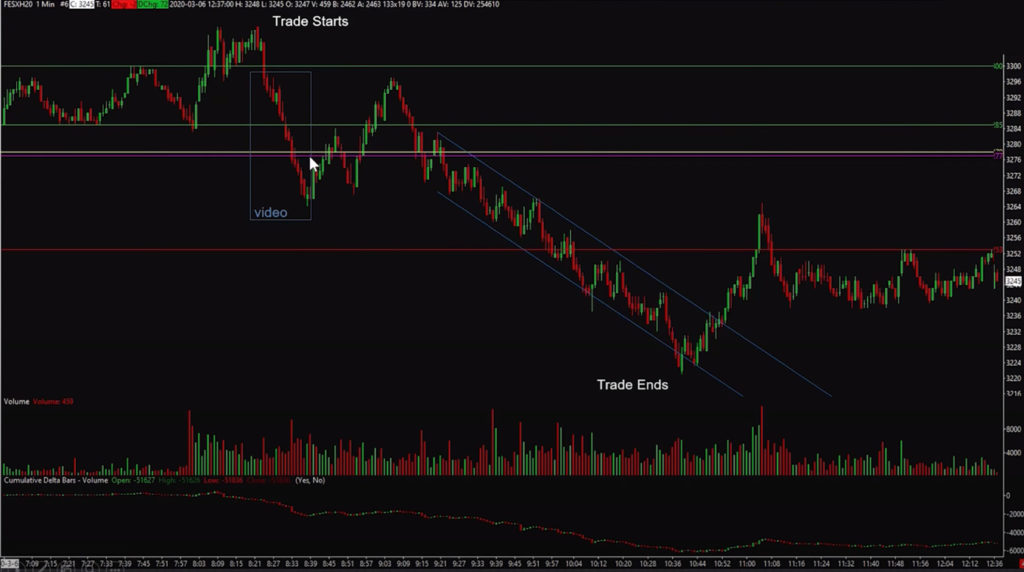
To put things into the perspective just before the moment of entry, this trader is looking at the battle between buyers and sellers around round number 3300, which happens to be just above the IB high. Here is the overall landscape of the trade with entry and exit locations.
Something that was not used in the video is a footprint chart, an inside look into the battle that this trader is interested in around his point of entry. Footprint chart enables us to see how much volume was executed on each side of the trade (bid and offer) and with what intention represented via Market Delta indicator. Here is the footprint chart at the scene of the crime:
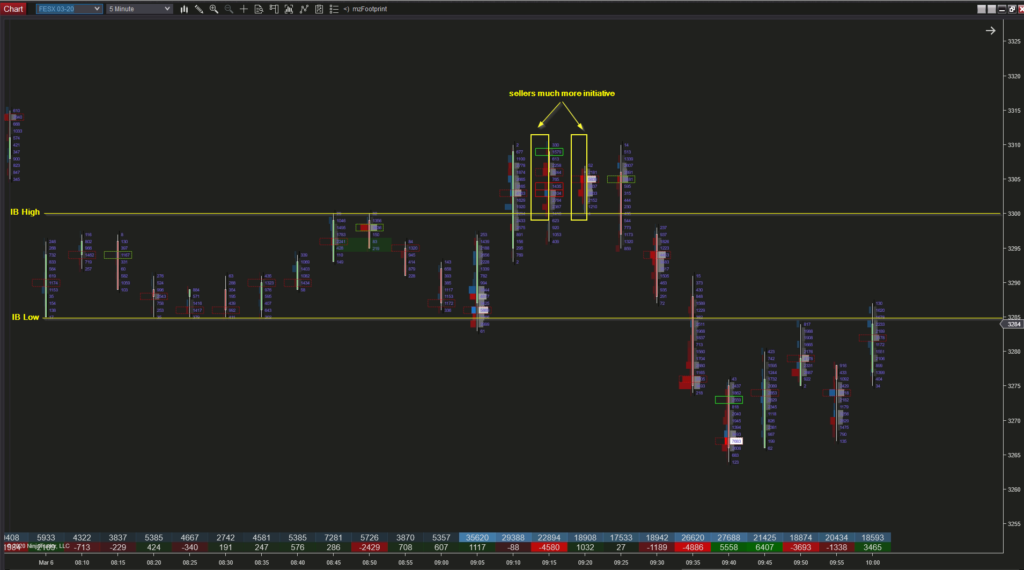
Chatting with the trader, let’s use his exact words to give this chart a little bit more clarity:
Notice how dominant were sellers hitting the bids between 3300 – 3310 which is represented by red color in the footprint chart. This goes in line with the quote above and can give you an additional clue on how to view the market next time you will be looking at the perfect location for entry.
Now that we have set the scene, we can move to the second part of the video which is trade management using price ladder. Although we have not been able to cover full trade in the video, we can decipher what is happening on the price ladder (DOM) for the beginning of the trade management. Usually explaining the ladder price action can be difficult so I tried to break it down in the areas of focus. I would like you to watch the video alongside the table down below. The table focuses on each rotation (on average 9ticks rotation) and what is happening inside that rotation. Here is the list of things I found helpful while breaking down each rotation:
- where velocity picked up and how the market moved after that
- how this trader scaled out of his large size as the market was going down
- the average size of the rotation that can signal your entry/exit positions
- where was large size sitting and how it affected the market after it was hit
Now let’s look price action broken down by each rotation:
| Rotation | Commentary |
| 3300 – 3291 | Market is strong and buyers cant lift the offer more then 3 ticks, trader won’t get filled at 94 to scale in more size into his trade. First scaling out coming at 91. |
| 3295 – 3286 | Velocity picked up at 91 and market gained momentum. Market is moving down with good momentum and healthy auction activity (both side is being traded well). |
| 3290 – 3281 | Reaching IB low at 85, first big size sitting on the bid at 80, 1192 lots. Market trades through that. |
| 3284 – 3274 | 77 is overnight low and you can see 2400 lots sitting on the bid. Market trades through that with a bit of sideways action. Trader is scaling out at 77 and 78. |
| 3279 – 3272 | Scaling out at 74 |
| 3276 – 3267 | Momentum picks up again going through 72 hitting new low on the day. Trader is scaling out at 71 and 72. |
| 3272 – 3264 | Another scale-out is positioned at 64 but market can’t get to full flick back to 64 and stops at 65. Trader feels that there is more sideways action going on and market might be poisoned for pullback Trader is adjusting his scaling out strategy moving from 64 to 65, 66 and 67. |
| 3269 | Market can’t revisit the lows and starts to move higher as trader correctly anticipated. |
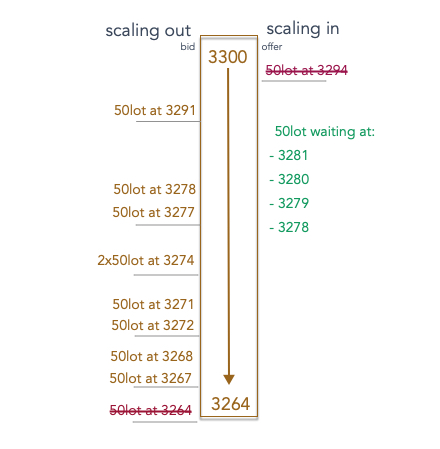
We can also have a look visually, where exactly this trader scaled out and scaled in of his large position. Something that is described in the table above, but maybe will give you more clarity when combining it all together with the picture below.
Breaking down the price ladder activity, we can now have more clarity into how a professional trader manages his position. It is never just about the perfect entry, or perfect trade management. It is about putting both things together and making them play to trader unique abilities and strengths that resonate with his personality. Hopefully, this breakdown was helpful and enabled you to gain some insights into multiple aspects of trade entry and trade management.
Trade well.
JK
To learn to trade order flow and develop your career as an elite trader then check out our order flow course and the full range of our Trader Training courses. Our flagship 8 Week Career Programme can be attended live on our London Trading Floor or virtually from home as an online trading course. These are the most comprehensive training programmes in the proprietary futures trading industry and are based upon years of successful in-house skills development.