How Can Footprint Improve Your Trade Execution Introduction
In this blog post, we will learn how can Footprint improve your trade execution. If you have watched a price ladder for a while, you can get a feel for the personality of the market. Given the number of data points trader needs to digest in real-time, Footprint is a great tool that can help you to zoom out. By zooming out, you can still observe the order-flow and not get drawn into every bid x offer change. That’s why a Footprint is a great tool that can make you less emotional and a little bit more objective by making a more visually appealing rule-based system. If you want to expand your understanding of the Footprint even more, don’t forget to read our previous article about Three Trading Techniques Using Footprint.
Using Footprint To Trade Around Iceberg
There are many ways how we can access our trades. Sometimes standalone patterns and market setups can provide us the access we need to unlock our desired trade.
In this case, an iceberg spotted on the Footprint created an opportunity in two ways. First, it created a poor high that needed reauctioning, and second, the liquidation out of the iceberg gave us the chance to enter a long trade. The moment the volume dried up after the liquidation, that was our chance to get into the trade.
What you see below is a Footprint chart of the EMINI S&P500. Starting from the top left red circle, you can see the color blue significantly highlighted in comparison to other candles. That is the Footprint chart setting for buyers aggressively trading into the offer, something what we call absorption.
From the Footprint chart is apparent, that the significant blue was an iceberg that held the prices and created an interim top. The market offered deeply giving us an attractive ceiling to attack when the market refills the energy.
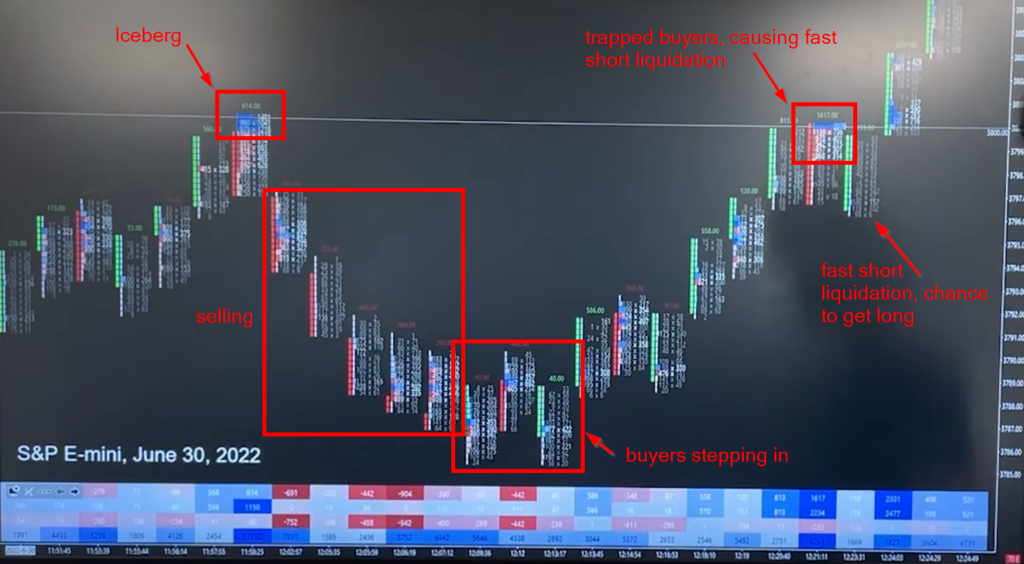
After the selling settled, buyers stepped back in providing us with delta reversal (third rectangle from the left). Delta reversal is characterized as two intervals next to each other (in our case a span of two/three candles) where one had a high negative delta and the next interval (candle) had a stronger positive delta, signaling a change in auction personality.
As we were approaching the original iceberg, we paused exactly at the same blue location as previously. Iceberg still unfinished. A fast liquidation of longs, that were trapped hoping for an iceberg to break got washed with no real selling obvious from the Footprint chart. This was your chance to enter a trade with a good location and nice RR.
So insights a Footprint could give you?
- visually clear areas where iceberg occurred (blue color)
- delta reversal signaling bottoming (negative x positive delta change)
- fast liquidation signaling liquidation rather than true reversal (no big sellers appeared)
Using Footprint To Trade Low Volume Node
“As long as buyers are in control, our trade is on”. But what does it mean for buyers to be in control? One way to exploit who is in control is to use a Footprint chart.
In the video down below, trader Isaac breaks down his ability to read the Footprint to decide, whether to stay in the trade or not. He relies explicitly on the low volume node formed at the specific location on the chart.
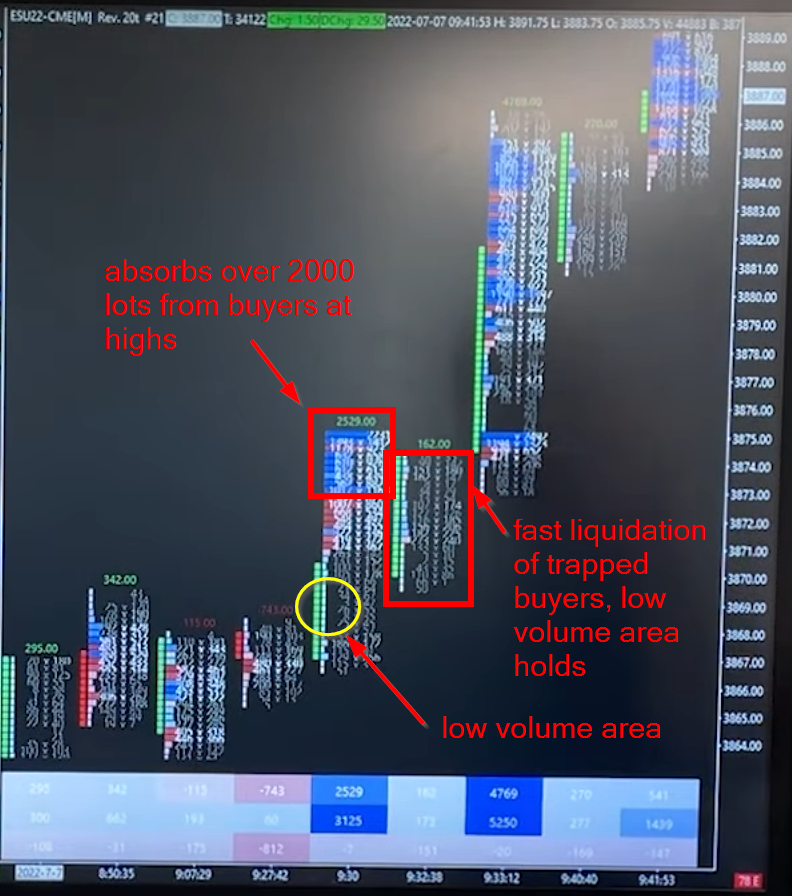
In the image below, we are looking at the chart of EMINI S&P500. Market is positioned to possibly open with an open drive and we are looking for Footprint clues right at the open.
The yellow circle highlights the break at the open where the market left a low volume area. As long as the market does not return to this area, this is a good signal for us to hold our long trade.
The market also placed a large volume of buy orders just above the low volume area as highlighted in blue. Another tell that buyers are aggressive and want to further lift the market. As long as the market holds above the low volume area, there is a chance for a market to keep lifting the offers.
The market provided us with fast liquidation and again, no big sellers appeared. Time for us to get long with very good RR, stop below the low volume area, and target based on the bigger picture structure.
Using Footprint To Trade Less Emotionally
Last but not least, trader Isaac shares with us a good lesson about the price ladder. On one hand price ladder gives us huge benefit in the understanding of the dynamic between buyers and sellers. On the other hand price ladder can make us more reactive and less objective.
Trader Isaac tried a different approach for a change. Instead of focusing only on the price ladder, he has focused on the Footprint when entering the trade. By doing that, he was able to lower the intensity of absorbing every bid and offer change and this practice made him less vulnerable during the initial phase of the trade. Learn what trade he took and how he was able to use the footprint to execute the trade by watching the video above.
If you want to learn how Axia Traders trade other Footprint patterns, visit the free workshop we are running at: https://go.elitetraderworkshop.com/Free
If you liked this type of content, you might check these videos as well:
- How to Start Using Footprint Charts | Axia Futures
- How To Become A Better Trader | Axia Futures
- What Really Good Footprint Action Looks Like | Axia Futures
If you like our content and would like to improve your game, definitely check one of our courses that teach you all the techniques presented by AXIA traders from a market profile, footprint, or order-flow. If you are someone who likes to trade the news, we have a great central bank course. And if you are really serious about your future trading career, consider taking AXIA’s 6-Week Intensive High-Performance Trading Course.
Thanks for reading and until next time, trade well.
JK