Now, let’s start with the trading toolkit used by the trader to identify the opportunity in the market. We will be primarily using these tools to evaluate the trade to get short in the Eurostoxx market.
In the breakdown of how each tool was used, I will be using the term signal, which is basically a term that gives you a clue if the market is more positioned towards the bearish or bullish side. As we break down each step of the way, it will become clear, that there are many signals that support the idea of the trader.
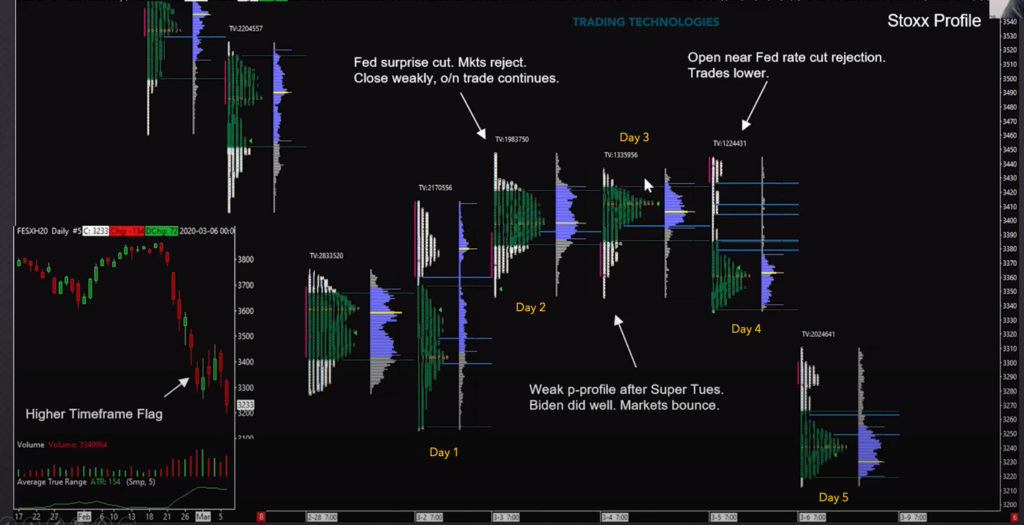
First lets set a scene and use picture below to explain the context for our tools such as Daily view, Chart pattern (bear-flag), News and Market profile:
Let’s start decomposing the analytical process of the Axia trader with daily big picture view:
| Tool | Context | Signal |
|---|---|---|
| Daily view | Strong downtrend in the midst of Covid19 crisis | Bearish |
| Daily Chart Pattern | Bearish flag with two attempts at low and then creating overlapping candle leaving low with no excess | Bearish |
Zooming in on the developing bear flag chart pattern, let’s break down the flag by using a Market profile to get an insight into how the value was created in this chart pattern formation:
| Tool | Context | Signal |
|---|---|---|
| Market profile | Day 1 – two attempts at low (with no excess leaving lows vulnerable) and then creating an overlapping candle Day 2 – rejection of the highs with good selling tail ending as balanced day Day 3 – P shape profile opening near the tail but with poor volume (a sign of lack of strength). The market would need significant volume to break higher Day 4 – b shape profile followed by Day 5 bearish opening Day 5 – Opening out of y/d’s range and below value (gap below) |
Bearish with signs of weakness on Day 2, 4 and 5 |
While this bear flag was forming, certain news hit the wires and could not lift the market higher. Here is the news that happens within bear flag:
| Tool | Context | Signal |
| News | Day 2 – Fed surprises with a rate cut and markets reject. Day 3 – Poor bid after good result for Biden after Super Tuesday |
Bearish when the market could not bid up on this news |
As we were reaching Day 4 of this bear-flag, there were a couple of nuances that happen. First, as we got to the lows on day 4 (b shape profile day), the volume increased, which is a sign of acceptance of lower prices and strength of sellers. Then on Day 5, we gapped lower. The key line in the sand was balancing in this overnight session. Now with the gap down and clear decision point above the current trading price, it is time to start looking at how we can access this trade, i.e., how we can enter the trade.
In order to access this trade, we will be looking at Initial Balance failure which is a concept used in Market profile. On Day 5, we are primarily interested in higher timeframe participants driving the market forward for the continuation move down. We are looking for the IB failure and size that is executed around the round number 3300. Although we don’t have a recording that we can review, there was clear sign while being above IB high, that higher time frame participants stepped in and a decent amount of size from buyers was repeatedly taken by sellers which were a sign of strength by the sellers. Something worth looking for around round numbers, where larger participants can get definitely more active. As long as the market could not move and follow through reasonably higher above IB high, it became obvious for this trader to access this trade and place a large order of 1000 lot to short this market.
As you can see, lining up a together trend, Market profile, daily chart pattern and context of news can produce high probability opportunity. It is patterns like these where the confluence of tools used for analysis can give trader confidence to execute the trade with big size. In my next blog post, I will review other important aspects of the trade which is trade management, and we will briefly touch a couple of order flow concepts used by this Elite Axia Trader.
Trade well.
JK
To learn more about how to day trade and develop your career as a futures trader within a professional environment then check out the Axia Futures 8 Week Intensive Trading Course and our other specialised Trader Training programmes. It is the most comprehensive training programme in the proprietary futures trading industry and is based upon years of successful in-house skills development on our trading floor.