How To Manage Your Trade Using Footprint Introduction
In this blog post, we will discuss how to manage your trade using Footprint. The Footprint is a powerful tool and can show us what actually happened between buyers and sellers. Given the speed of the markets, this is a great tool to understand what buyers and sellers think about the current price as demonstrated by their actions. We will review a Delta reversal clue in EMINI S&P500 and what followed afterward. We will discuss the absorption and one-time-framing in Oil after the initiative action. All of these clues can improve your data-driven judgement about what might happen next. If you are interested in other Footprint strategies, visit our previous post about Footprint execution. Now, let’s review the detail of the two trades we have introduced.
Footprint Trade Management In EMINI S&P500
This trade happened to be in the EMINI S&P500. The general idea is to play the key auction reversal at the important inflection point. As we are approaching this inflection point, we see volume increase and sellers hitting the bid. Then comes the first sign of buyers lifting the offer but still lacking aggression. You can tell the buyer’s presence by the Footprint changing to pale blue. This now becomes an important time to watch since buyers are slowly stepping in (see here).
Let’s review what we are seeing down below. We see expansion in volume, volatility, and negative delta. If taken in isolation, this can be a sign of either market starting a new trend or a mark of the market making a new swing low. Mark of a possible reversal. Now, it is very important what happens next. Next, we can see aggressive buying, and the market leaving a Delta reversal clue.
Given our idea for key auction reversal, given the location, this comes at a point where we expect the market to provide us with such a clue. Great! Now it is all about the ability of sellers to show their initiative and buyers’ ability to absorb and lift the offer.
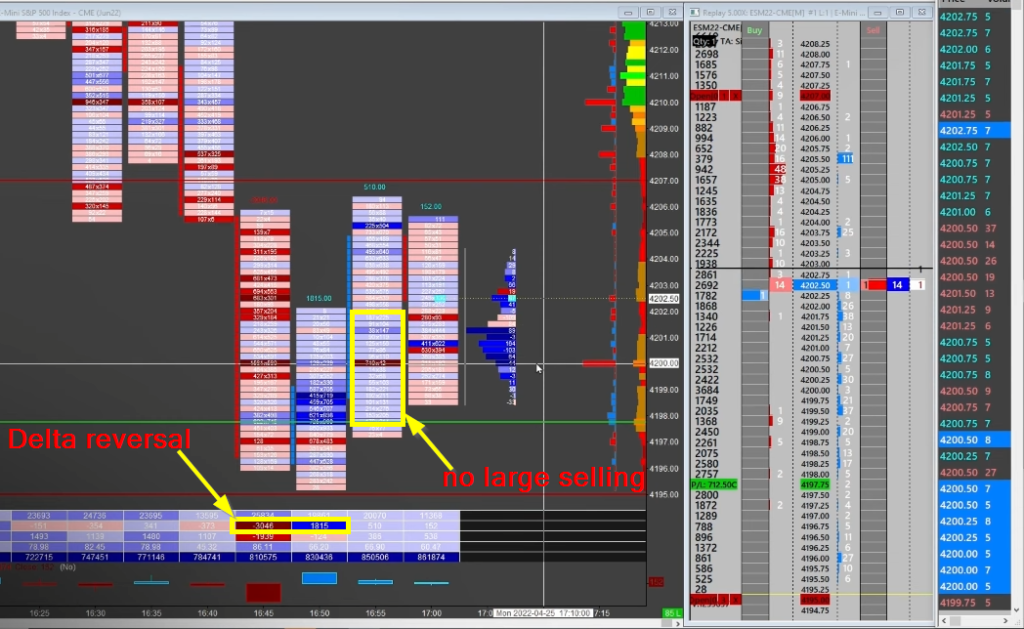
As we can see, no large initiative selling stepped in after the Delta reversal. We can see a pale blue on the Footprint most of the time. This is a sign that buyers are in control and sellers given their strong initiative earlier might not have the strength to push the market further down.
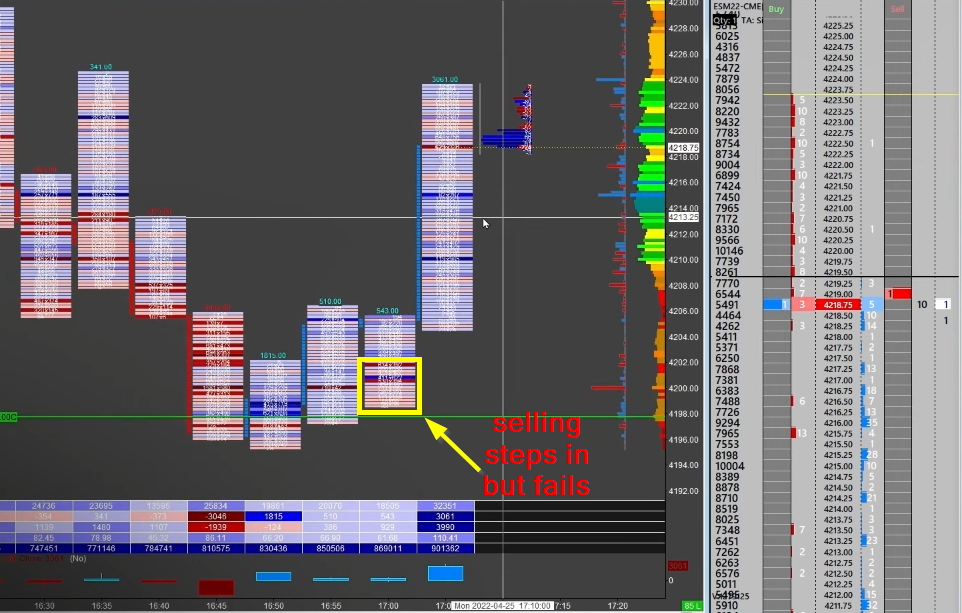
Given the location of 4188 (dark blue), that is our line in a sand (LIS). Sellers had one last attempt to test our location, the point where buyers initially stepped in. You can see above that selling pressure increased into our LIS but were unable to achieve anything, no follow through down. Now, the trade is on, now is the time to hold onto your trade since you have done the hard work.
Footprint Trade Management In Oil
In this case, we are looking at the chart of Oil. After we have initiated our long, the natural tendency of the market is to find some responsive selling. The moment it does, we need to understand what type of rotations are expected. What is a “healthy” rotation and what is a “warning” rotation.
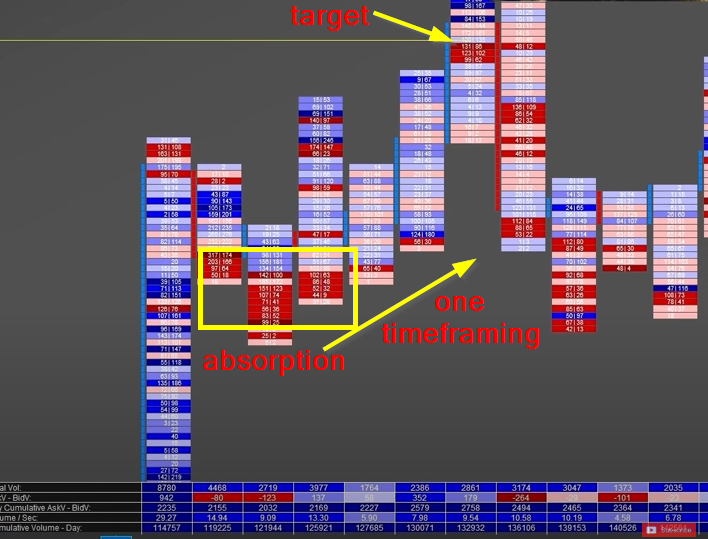
Looking above, we have done a very nice volume of 8780 contracts traded to the upside. Healthy rotation back should be smaller in terms of volume and range size. And it is, the next bar traded 4468 contracts followed by 2719 contracts.
As you can see from the footprint, we could also expect some absorption at the lower part of the rotation. In this case, visually bars turned red signaling selling pressure that got absorbed. This selling pressure is also clear from the negative delta. We have a negative delta but a healthy rotation. Good sign!
As we started to move slowly higher, the next bar was unable to put lower low. This gave confidence to this trader that we might start one-time-framing higher and upside momentum will get back and push our trade to the desired target.
If you want to learn how Axia Traders trade other Footprint patterns, visit the free workshop we are running at: https://go.elitetraderworkshop.com/Free
If you liked this type of content, you might check these videos as well:
- How to Start Using Footprint Charts | Axia Futures
- How To Become A Better Trader | Axia Futures
- What Really Good Footprint Action Looks Like | Axia Futures
If you like our content and would like to improve your game, definitely check one of our courses that teach you all the techniques presented by AXIA traders from a market profile, footprint, or order-flow. If you are someone who likes to trade the news, we have a great central bank course. And if you are really serious about your future trading career, consider taking AXIA’s 6-Week Intensive High-Performance Trading Course.
Thanks for reading and until next time, trade well.
JK