Three Trading Techniques Using Footprint Introduction
In this blog post, we will explore three trading techniques using footprint. We will break down two types of trades, one in EMINI S&P500 and another one in NASDAQ. We will use Footprint chart to visually identify pivot points that helped our Junior trader Alex to access and manage both trades. We will also reference the previous article, where we discussed the JUMP trade technique which Alex used for his access to the NASDAQ trade.
Trading The Reference Block Using The Footprint
This trade happened to be in the EMINI S&P500. The general idea is to play the key auction reversal at the important inflection point. As we are approaching this inflection point, we see volume increase and sellers hitting the bid. Then comes the first sign of buyers lifting the offer but still lacking aggression. You can tell the buyer’s presence by the Footprint changing to pale blue. This now becomes an important time to watch since buyers are slowly stepping in (see here).
As we watch the orderflow, we can see for the first time real aggression from buyers stepping in. Observe how at 97 and 98.50 73 lots and 40 lots starts to lift the offer with other orders following. Again, watch the footprint as the patch of blue appears. We now have a confirmation that buyers are truly interested in this reference block. It gives us a first chance to get long.
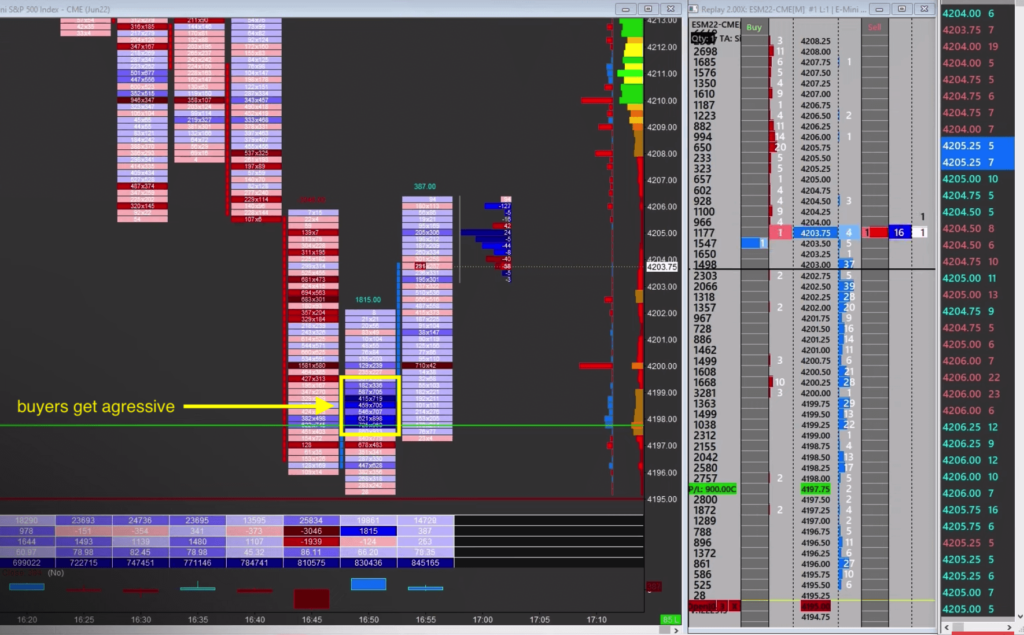
So how can we use the footprint to our advantage? First, we can spot that our reference area is getting confirmed by the interest from buyers. Remember that patch of blue that got darker? That is a signal that visually highlights much stronger interest than on previous prices. First clue.
The second clue is how suddenly that reference block gets defended on the retest by the buyers . And last but not least, there is no selling pressure stepping in on the retest.
These three clues give you a chance to place a high risk-reward trade because the location has become important for buyers to defend.
Trading Low Volume Nodes Using The Footprint
This trade happened in the NASDAQ. Here, the trader has waited for a while and must have been patient for good absorption to happen first. Jumping early would cost him both confidence and monetary capital. As the absorption progressed it has become clear, by observing the footprint that sellers are losing their strength. Again, visually obvious from the pale red color.
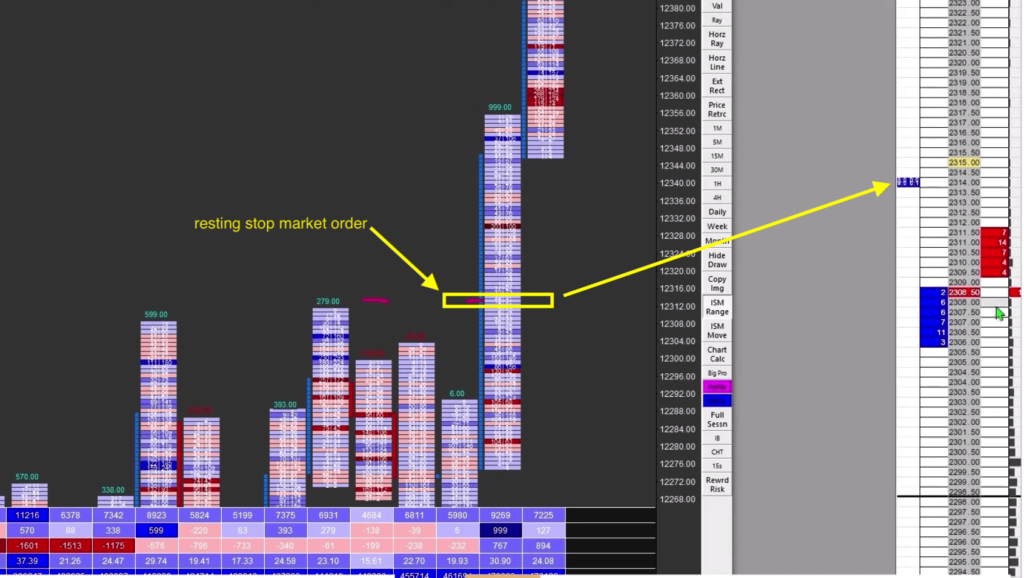
Ready to get long, this trader understands the NASDAQ’s nature. Thanks to its thin nature, larger rotations are expected but the underlying expectation is this: the moment market crosses the marked line 12314, the resting stop market order will get hit. What is expected is the JUMP type of trade after the resting stop market order is triggered.
As the market hits the order, it fluctuates for a moment and jumps after two short rotations. That is your first Footprint signal. The JUMP produces a low-volume node.
Now we want to see the auction aggressively lift offer, auction larger patches of orders creating a high volume node and leave another low-volume node behind.
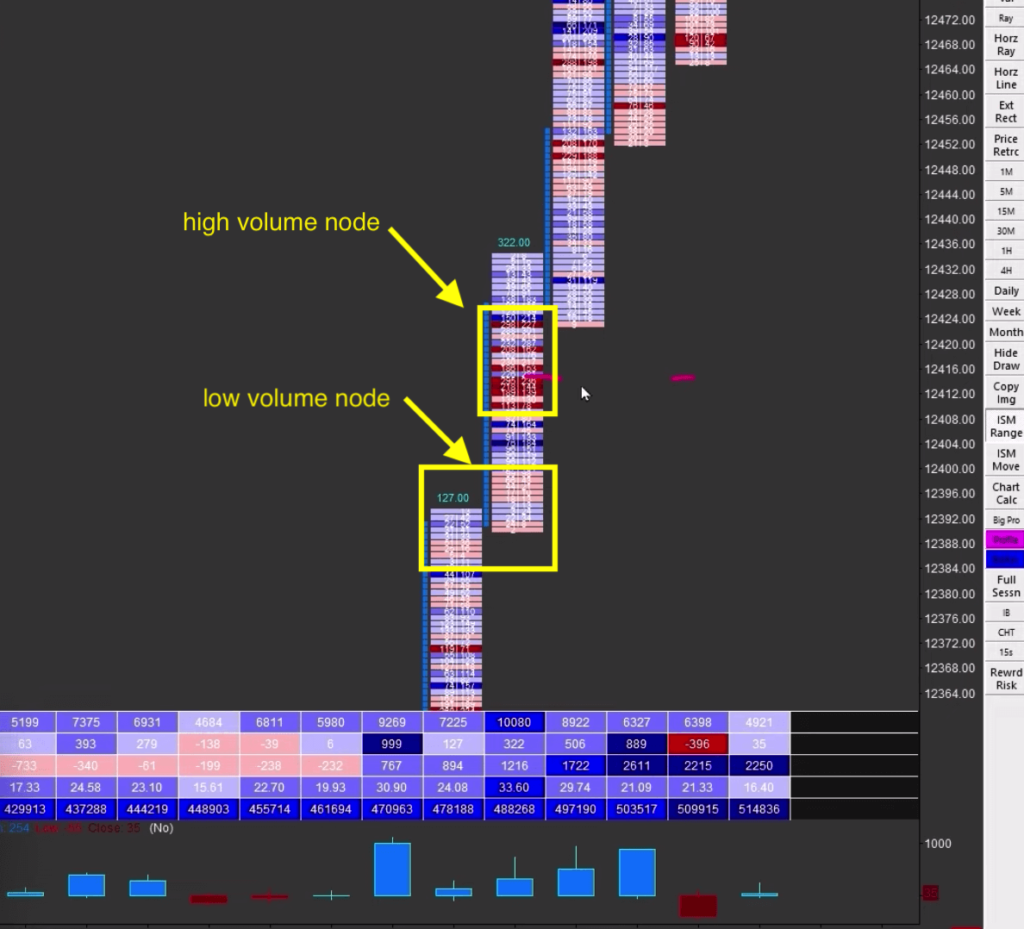
Following footprint, you were given three clues. Drying up of the sellers before the JUMP. The JUMP clue leaves low volume nodes behind and highlighted blocks (high volume nodes) after the low volume node.
If you want to learn how Axia Traders trade other Footprint patterns, visit the free workshop we are running at: https://go.elitetraderworkshop.com/Free
If you liked this type of content, you might check these videos as well:
- AXIA Junior Funded Trader Remains Composed After Missing Vaccine comment Live Trading
- AXIA Elite Trader trades Gilts & GBP On Bank of England Rate Decision
- AXIA Elite Trader Attacks 4 Markets On July 19 FOMC Rate Decision And Presser
If you like our content and would like to improve your game, definitely check one of our courses that teach you all the techniques presented by AXIA traders from a market profile, footprint, or order-flow. If you are someone who likes to trade the news, we have a great central bank course. And if you are really serious about your future trading career, consider taking AXIA’s 6-Week Intensive High-Performance Trading Course.
Thanks for reading and until next time, trade well.
JK