Introduction To Price Action Trend Day Strategies
Trading trend days can be at times challenging endeavor, in which it is equally important to first characterize the day type as trend day and then choose appropriate price action trend day strategies. Selecting appropriate trend day strategies can be crucial for our success in the market. Many times with the trend day, we have to be a little bit more aggressive in terms of our execution because not always we will be able to get our orders filled. In our previous article, we went into depth on how to spot a trend and liquidation day. We will use the observation of the article and chart example from the video down below to focus on how that day could be traded.
Market Clues For Trend Day Identification
In order for us to use appropriate trend day strategies, we first need to collect enough evidence that we might be dealing with the trend day. Here is a brief recap of market clues, that gives us that potential evidence:
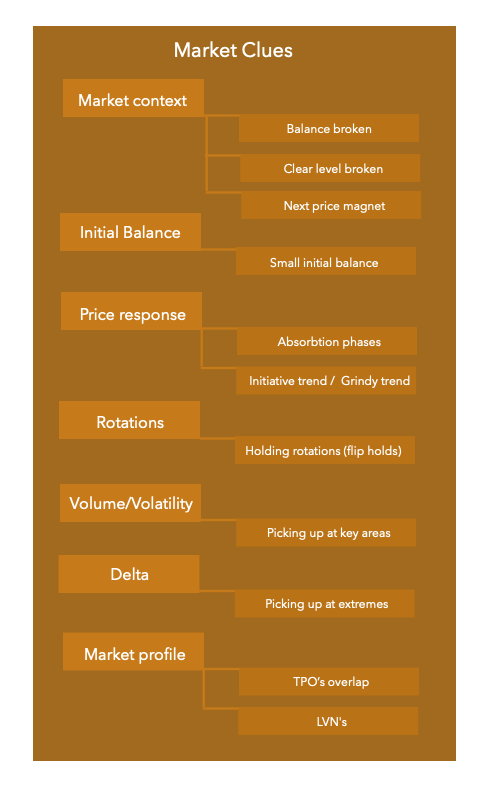
Market clues such as volume & volatility, market delta, or degree of TPO’s overlap are additional clues, that give us a sense of the battle between buyers and sellers. For example, using market profile and degree of TPO’s overlapping each other, it gives us an idea of what will likely happen next with the price action. This overlapping TPO’s means acceptance for these prices at the current point in time. When the acceptance changes, we need to become aware of that because then there is a potential for new flows coming into the market driving prices in a trend like fashion. Clues like these are in much more detail explained in the video down below and are a great addition to our previous blog post so definitely check this out or consider our market profile trading course to get a better understanding of how to use these concepts in greater depth.
Price Action Trend Day Strategies
Once we are aware, that we might be set up for a trend type of a day, it is now the critical time to ask ourselves what type of strategies we can use. In essence, we are looking for a simple access strategy that would enable us to get into a trade on a trend day. In general, there are numerous access strategies you can use, but I will primarily focus on these two categories:
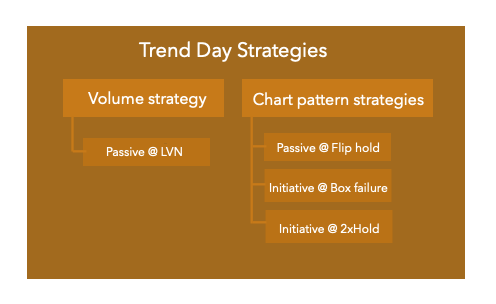
You can see that the access strategies are divided into volume and price action, passive and aggressive. The passive type of strategy is a strategy when you pre-empt and place your limit order waiting for market to hit it. The aggressive type of strategy is the one when you are waiting for market to provide with your trigger and then you hit the market. Obviously there are many more strategies you can use, where you can be for example much more aggressive trading breakouts, but for our particular example that happened recently in a Bund trend day, these are the access strategies we will be focusing on.
Applying Trend Day Strategies in Bund
Let’s have a look at the Bund trend day and let’s do a quick checklist with our clues. First, we will start with a context in which Bund is breaking out of multi-week (5 weeks) balance zone.
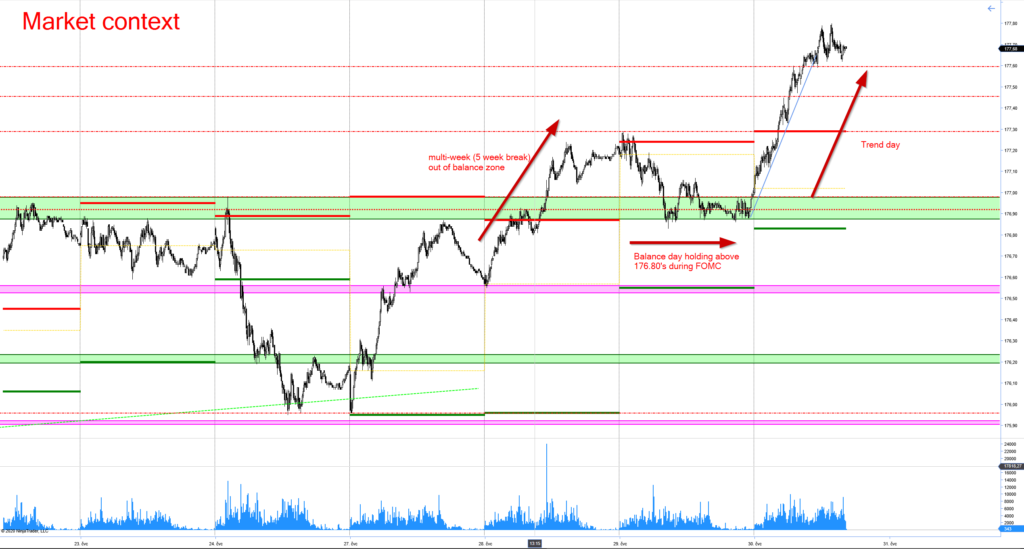
After we broke from the multi-week balance, we have put in a balance-day that happened to be on an FOMC day. That day FOMC did not produce any significant news that would invalidate our trading idea, which is: we are breaking out of multiweek balance on a good volume, we have confirmed our break with producing balance day just above the multi-week balanced highs. We have cemented our structure even more with this “break and hold” balance day. We might be potentially set for a trend day higher the next day.
First, let’s run a checklist with clues until IB was broken at the beginning of the trend day:
- Market context – breaking out of balance on a good volume, confirmed by balance day holding above the multi-week highs. There is a clear price magnet to aim at 177.78 which is weekly high from 5th of May 2020. Target approximately 70 ticks away from current prices around the open.
- Initial Balance (IB) – average IB size, definitely not wide IB, so this clue is not very indicative. What is indicative is the drive with which we are trending within the IB.
- Price response – after IB was broken higher, we have absorbed and created a break and hold range from which we broke further, leaving behind LVN’s. This initiative that broke the market higher, followed by absorption will be very typical and characteristic for the remaining of the day
- Rotations – rotations are holding (flip holds, see explanation below). Each expansion higher is followed by balance, which is followed by expansion again.
- Volume – is picking up at key junctures
- Delta – this clue was non-indicative for this day, delta stayed positive throughout the day, but did not create new extremes as the price was creating new extremes.
- LVN’s – are created in a moderate fashion. This signals a more grindy type of a trend but a still trend type of a day.
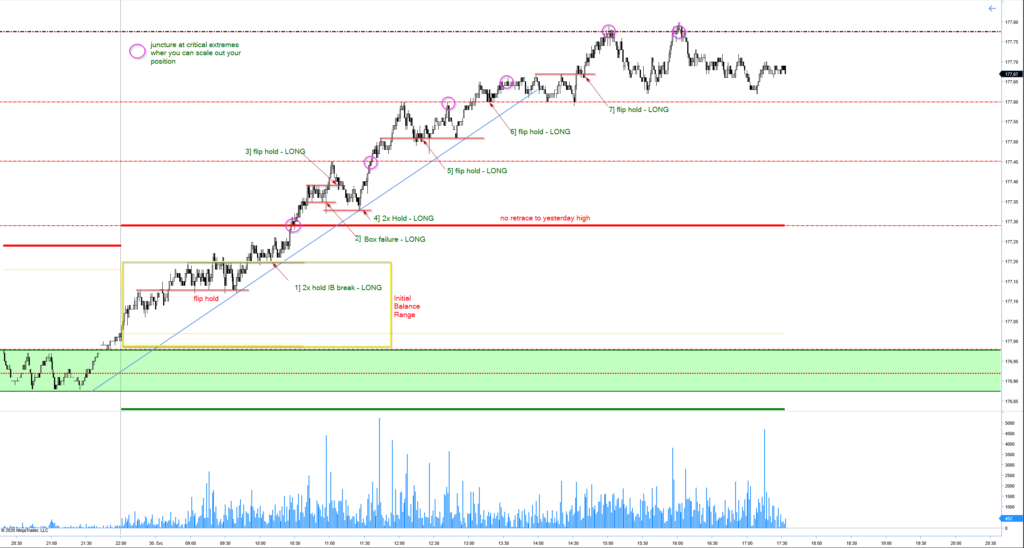
As you can see, you could have executed 7 potential entries using price action access strategies. Again, many more access strategies can be used to get into a trend day, but we have picked particularly these three:
- Passive @ Flip hold – enter passively once the previous resistance is broken. The idea is that the resistance becomes support (hence the “flip hold” name) and will continue to hold in a trend day.
- Initiative @ Box failure – wait for the tight range to break to the downside and come quickly back into the range (box). That is your signal to get long since the idea behind the trade is that the lower prices were clearly and strongly rejected and market would like to continue higher.
- Initiative @ 2xHold – once the price breaks higher but stays immediately above but at the breaking price, it is a sign of acceptance of higher prices but not yet fully strong acceptance. Once the price touches twice this breaking price and starts to run higher, initiate your trade.
Applying Trend Day Strategies in Stoxx
The same set of strategies we can apply in the trade explained in the video at the beginning of the article describing the trend day. Specifically the Box failure, Flip hold and LVN access strategies.
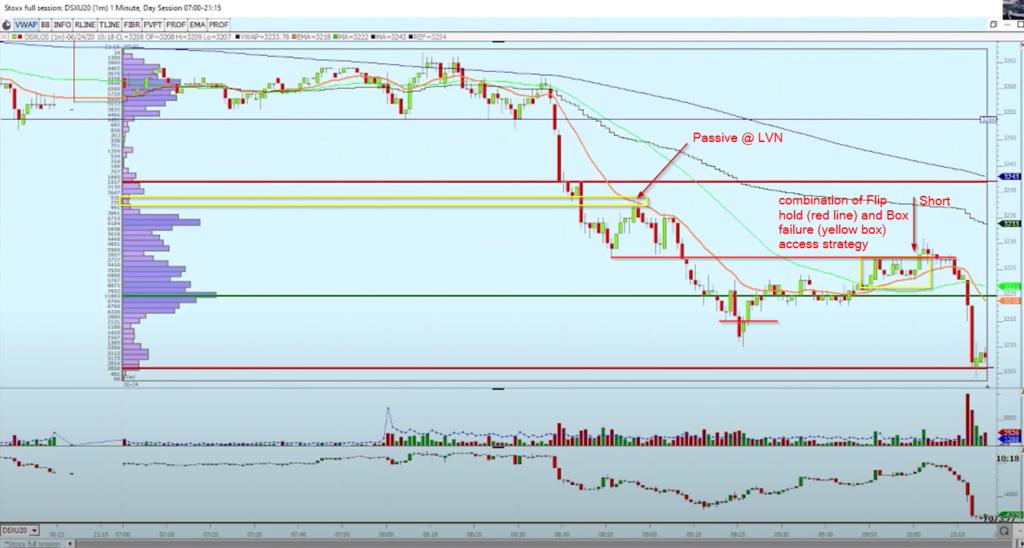
As you can see, you could have applied a similar set of strategies once you have identified you are dealing with the trend day as in a Bund trade. Check out the chart for places, where these strategies could have been traded.
Trend Day Access Strategies Recap
We all know that any strategy is as good as the underlying dynamics of the asset you are trading it with. Understanding the day type gives you the opportunity to correctly select the access strategies in the more appropriate direction of the market. Many times, we select an inappropriate set of strategies and try to fade the trend day all day long, creating bigger and bigger losses. Tools such as these will help you not only identify that it might not be the best idea to fade the market, but rather turn the situation around and start using strategies that help you trade the trend and not trying to catch the falling knife.
In case you are interested in finding out more about trader training to learn how to trade and explore other great trading strategies, check out our futures trading course that teaches you exactly that and more.
If you liked this type of content, you might check these videos as well:
Thanks for reading and until next time, trade well.
JK
Axia Futures
4 Endsleigh Street London GB WC1H 0DS
+44 20 3880 8500
https://axiafutures.com/
Social Media:
Facebook: https://www.facebook.com/AXIAFutures/
YouTube: https://www.youtube.com/AxiaFutures
LinkedIn: https://www.linkedin.com/company/Axia-Futures/
Contacts:
Demetris Mavrommatis – Co-Founder, Head of Trading
Alex Haywood – Co-Founder Head of Strategy