Introduction Into Day Trading VPOC and Market Profile
In this article, we will be looking at how day trading VPOC and market profile can help your futures trading journey. At the end of the day, as traders, we depend on levels and VPOC (Volume Point of Control) is just another reference on the chart. It can become powerful when combined with the market profile context. It is the market profile context, that can give you an additional level of conviction in day trading the VPOC level. Every time we are using any reference point in our trading, we should always ask ourself two key questions:
- What does it mean?
- Is there an edge in the context entering the trade?
- Where is the trade?
- How can I access this trade?
What Day Trading Tools We Will Be Using?
In order for us to understand the context, we will be using these market tools:
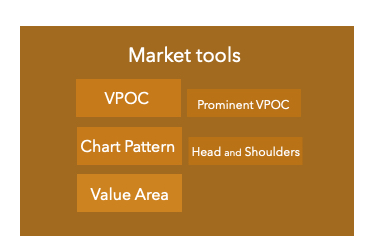
We will be talking about VPOC and Value Area primarily. In our case, we will focus on using these terms in relation to the daily interval:
- VPOC (Volume Point of Control) – is the price, where most of the volume traded over the day
- Market Profile with prominent VPOC – profile, that has clearly one significant VPOC
- Value Area (Value) – is the range, where most of the volume (70% of the volume) has traded for the day
Building Day Trading Context
In order to get the full context of this day trading concept, please have a look at the video, where an Axia Trader from our trading floor explains this concept in detail.
Market Analysis
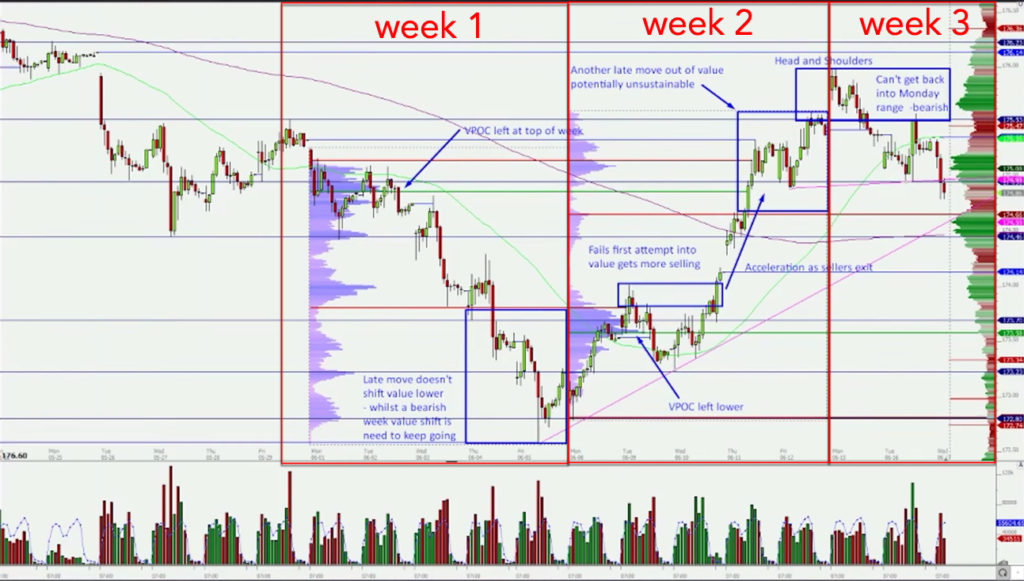
We will be looking at Bund charts. First, we will look at value creation, then market profile, and finally how we could have used VPOC in our day trading strategy. In order to understand when we can lean on VPOC more than any other reference point, we will start with the first week when Bund made the lower move. If you have watched the video, you know that Bund price moved lower, but the value area did not shift lower. Although we moved down later in the week, the value did not shift together with the price. This can be the first clue, that market is not fully accepting these prices and we might have a retracement the following week.
In the second week, we have fully retraced the move. Early in week three, we have created a head and shoulders chart pattern at the highs of week one and week two. Now, this is the place where it starts to get interesting.
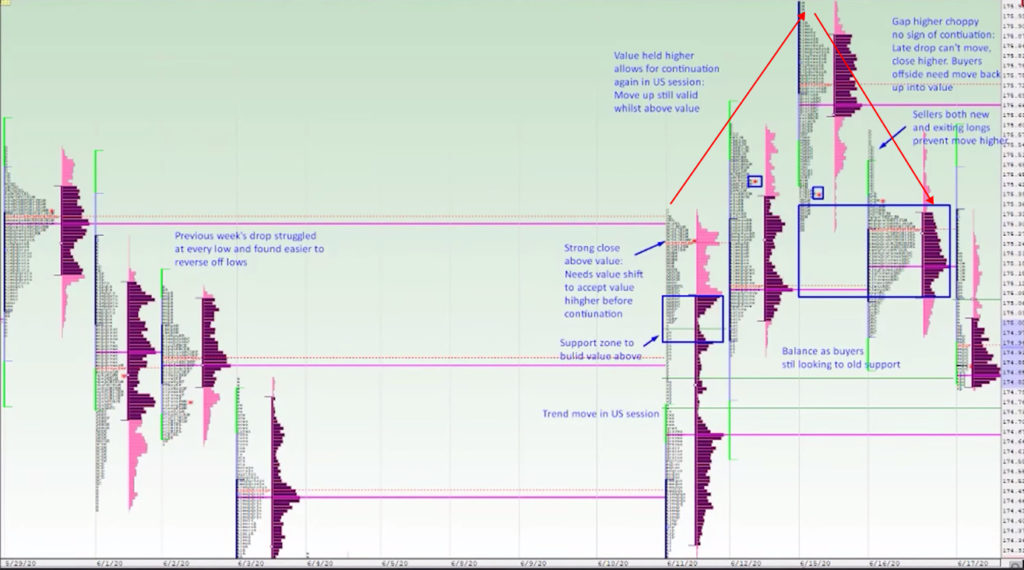
Let’s zoom out on the market profile to see what is happening early in week 3. By looking at the chart below, you can see that although value shift higher, when we gapped (top of the chart), we could not sustain the move and we have moved back lower the following day (see red arrow up and down), for which we have created a “head” in the head and shoulders chart pattern. Now, this is the moment, where important reference VPOC will be formed.
On the day of our trading, we have multiple clues lined up. We know we have retraced week 1, but the market did not have the power to continue higher. Our first bearish clue. We know, that market could not sustain the move higher and created this head and shoulders pattern. Our second bearish clue. The right shoulder was formed on a balance day with a pretty prominent VPOC. Now it is our time to use this information and combine it into a tradable idea. We can now answer both our questions that we have presented at the beginning of this article. We know that the trade we want to take is bearish and we know that prominent VPOC (see below) has been formed. It is time for us to define access to this trade. Let’s have a look at the chart and see how this trade developed.
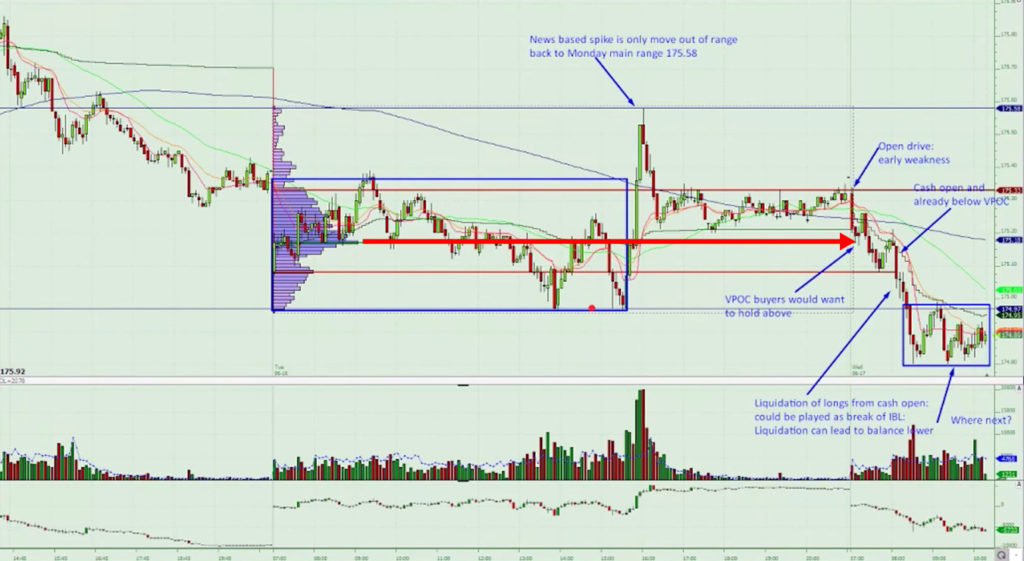
Our VPOC is marked with red arrow. But how to access this idea? One of the strategies we can use for the access of this trade is to observe price action around VPOC. We know, that for a prominent VPOC such as this one, buyers would like to hold above. In this trade, we have one more bearish clue and that is open drive move down, which is a sign of early weakness. To access this trade we can:
- Use more initiative approach – use a breakout strategy to short through the VPOC. One such strategy can be for example combination of the VPOC and break of the Initial Balance.
- Use more passive approach – use a passive continuation strategy to access the trade once the price gets below and retraces back to VPOC.
Trading Summary
It should be now more obvious, that day trading VPOC without context can produce mediocre results. The moment you connect the context of value, price action, and chart patterns, you can get more conviction on your trades. Then it is all about accessing trade and trade management. In case you are interested in finding out more about trader training to learn how to trade like these, check out our futures trading course that teaches you exactly that. If you would like to find out more about market profile, I would highly recommend our market profile trading course. In my next article, we will look at how we can template this VPOC approach and build repeatable principles that can provide a good trading edge.
If you liked this article, you might check these as well:
- How To Use Market Profiles In Your Morning Prep
- Why is Day Trading Futures Not Simple
- Eurostoxx Initial Balance High
Thanks for reading and until next time, trade well.
JK