In this blog post, we will be looking at Elite Axia Trader executing a trade idea around Initial Balance High in the Eurostoxx on March 10th in the mids of big volatility days after coronavirus fears. We’re going to take a glimpse of multiple tools that were used such as market profile, daily chart pattern, intraday price action, and order-flow. Let’s first have a look at the market contextual landscape.
Eurostoxx Market Profile Landscape
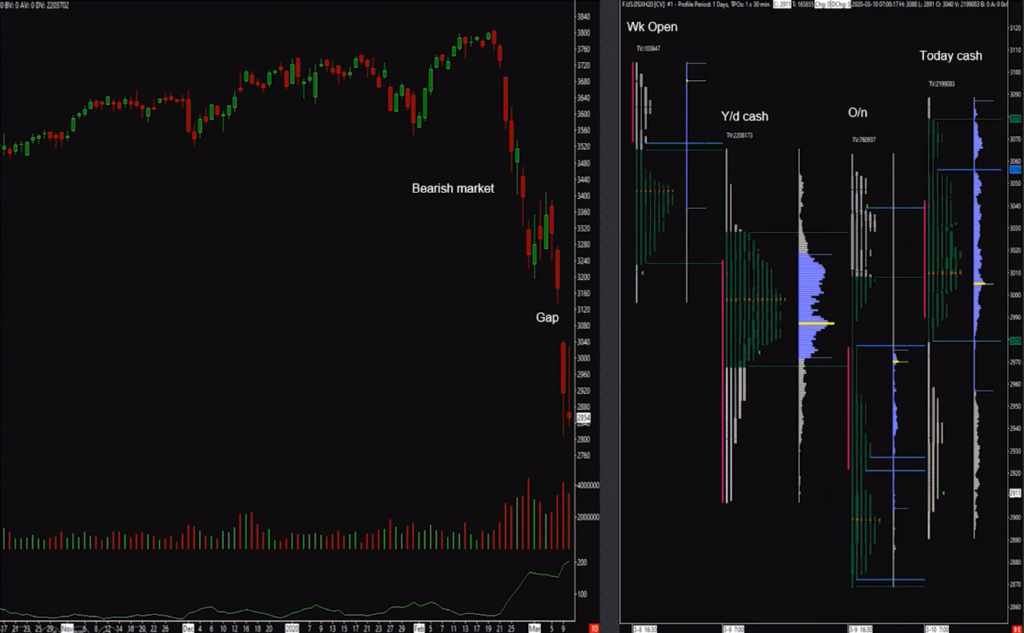
In the greater scheme of things, looking at a daily candlestick chart, we are already seeing coronavirus conditions with the market being exceedingly bearish. After forming a daily flag in the previous week and breaking it lower on Friday, we then open next week with a big gap down. On Monday market closed again negative, and the trade we are taking a look at was executed the next day.
The chart on the right shows the Market Profile session breakdown with:
- Wk Open – from the open on Sunday night to start of the cash session
- Y/d cash – Monday pit session
- O/n – from Monday pit session close to Tuesday pit session open.
- Today cash – session on Tuesday 10th of March which we are discussing
What we take from it is that on week open after market gaped down it stayed below the gap (Wk Open), but on a cash session (Y/d cash) it bounced off from lows closing within a balance. Then on overnight (O/n) session sellers managed to break the lows of cash session – showing once more that they want to push lower and that lows are still vulnerable. However, with coming closer to Tuesday cash open we moved higher and higher all the way above the pit session Value Area.
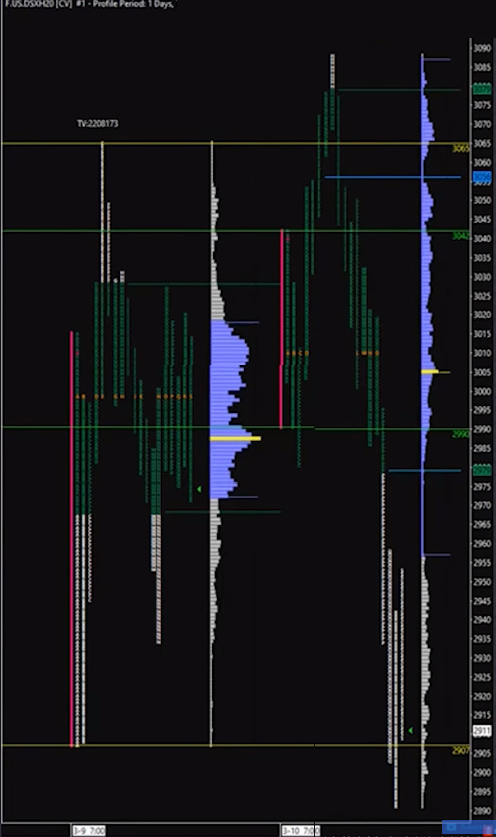
Let’s now take a look at the Cash session Market profiles above. We got Monday on the left, is the pretty balanced day, although because of the weekend gap the sentiment outlook is still bearish. On the right, we have a pit session of Tuesday opening above previous day Value. With a bigger trend aiming down and the gap above, the market is in a decision-making point in which we will either see sellers coming once again and pushing market lower, or buyers attempt to move price into the gap area.
Ideas for a trade:
- Trend continuation – Getting below yesterday’s POC and VPOC levels and holding below them would be the first signal of sellers getting control and us wanting to position short targeting yesterday’s lows.
- Test the gap above – Rejection of these levels could indicate that there’s potential for a move higher.
Initial Balance High – Closer Look
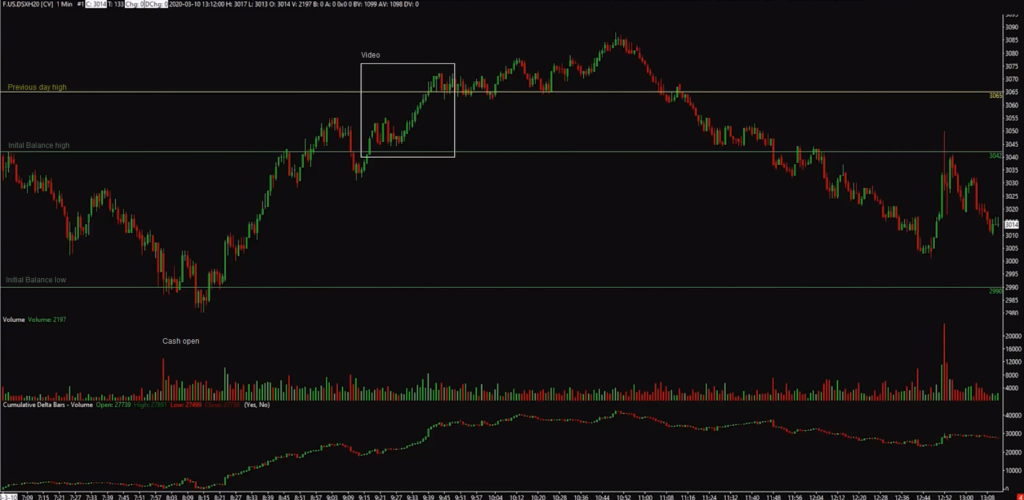
On the 1 minute chart above you can see with the first candle at 7:00 that the market started drifting lower forming Initial Balance(IB) between 3043 and 2990 levels. After cash opens the market pushed below IB and then quickly rejected that move with impulse higher above Initial Balance low. Then, after a few minutes, buyers move higher all the way up to IB high, eventually breaking it. At this point, we can already see that there are buyers present and willing to pay higher and higher prices. When sellers push the market back below IB high the move cannot be sustained and goes again above 3043 levels. This is the stage that presents some areas in which Axia Elite Trader starts to looking for an entry for a continuation higher, targeting the break of the previous day high. In the next part, we’ll also dig into Order Flow in that area.
How To Execute A Trade Idea?
Information we got from analysis helped to build an idea, but how to best access that idea?
First, we go again by checking the boxes to make sure that everything is in place:
- The market failed to position short below yesterday Volume Point Of Control
- Price getting above today IB high,
- After testing back the Initial Balance area it got bought up again straight above IB high
After having that our focus turns to Price Ladder as we want to find the best entry point.
Watch The Live Execution On The Price Ladder
Unpacking The Order Flow That Followed
From the price ladder point of view, we can see that when the market approaches 3055 someone is reloading offers each time buyers trade into it and then pushes prices back again to 3052 when previously buyers hold. So we notice this two-way trading at those levels, but as soon as 3052 is turning offer – market drops. There’s very little selling, and almost no auctioning at these prices allowing the prices to fall to 3047-46 area – suggesting that bids just backed off pulling liquidity. That’s what our trader was looking for, he perceives this behavior as a sign of a strong buyer who finding the seller around 3055 now wants to get the best prices possible. Now auctioning develops around 3045-48 prices – this is where Elite Trader gets his entry filling his first and second 50 lots order. What he doesn’t want to see now is the market getting back with conviction to 3042 levels where the IB high is, and below that. When we get to 3044 however, there’s very little selling into that price, and 45 are getting lifted quite fast. Seeing that he increases his size by another 50 lots. Even though the price goes offer in 3045 again there isn’t any acceleration in the selling and again no one sells 3044. What’s hard about this trade is that it seems that the buyers are weak, but as soon as we stay above 44 and 42 levels trade idea is still valid. After a few moments, there’s a pick up in pace and more size trading up into 3050 and then taking 550 lots on the level above pushing prices higher to 3055 where buyers struggled last time. We auction there for a while but you can still see buyers initiative especially after 1000+ lots bid shows up first at 3054 and then moving on to 3056 driving market even higher, for the eventual break of the highs.
Key Takeaways
- Build your idea from the bigger picture setup
That helps you to prepare expectations of how the trade could play out, making you vitally sensitive to specific kinds of behaviors you want to see. - Price ladder for confirmation
Seeing the order flow playing out your way and getting validation of the presence of appropriate participants you can then position alongside.
Hopefully, this breakdown will help you to become a better trader and gain some more insight into how to build trade ideas, execute on them, and manage your position once you’re in. To engineer your process make sure to check the Axia Career Trading Programme – it is designed to do help you construct a truly professional approach for futures trading.
Begin Your Trading Career
If you’d like to learn to trade futures and develop your career as an elite trader then start building your skills with one of our Trader Training courses. Our flagship 8 Week Career Programme is the most immersive experience available and can be attended live on our London Trading Floor or virutally from anywhere in the world as an online trading couse. It is the most comprehensive futures training programme in the world of proprietary futures trading and is based upon years of successful in-house skills development with top performing traders.