Market Profile Insight Into Head & Shoulder Pattern Introduction
In this blog post we will cover how market profile insight of a head & shoulder pattern could give you an edge in managing your size properly and squeezing as much opportunity as early as possible. This is a textbook chart pattern trade executed differently than the textbook suggests. Elite Axia Trader in this trade has used market profile insights to find a vulnerability in the potential upside move and used it in managing his size early in the move. Let’s have a look what those vulnerabilities are and how one can identify them in their own trading.
For full context of this article, watch the video down below.
Market Profile Context
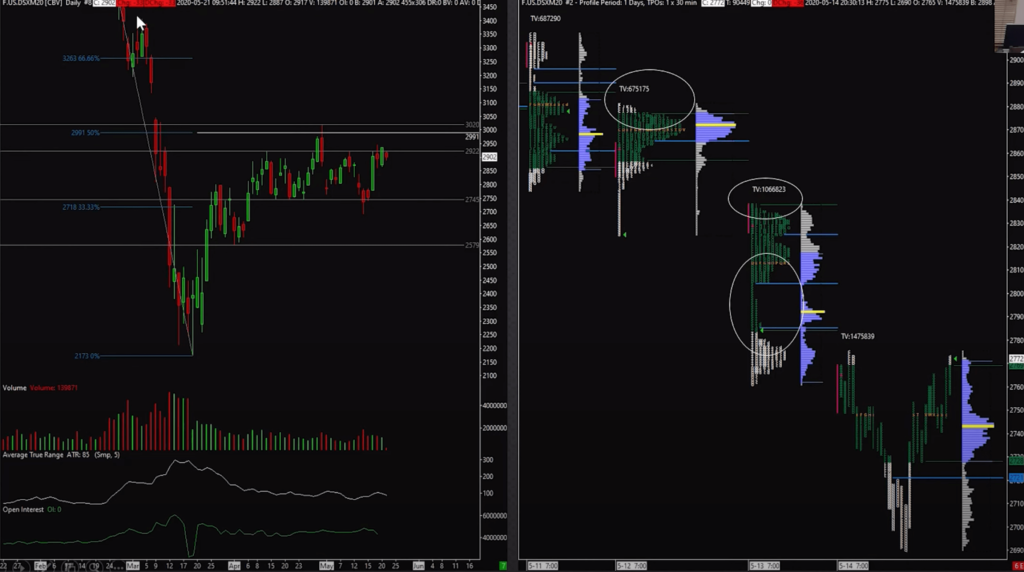
This trade has happened after a pandemic sell-off in March 2020. We are in the middle of May 2020 and the market has just topped at the 50% retracement. As you can see from the chart below, the market profile is offering a couple of insights into how the structure towards the low of the second shoulder was formed (see market profile on the right side of the image). Although this trader likes the idea and big picture bias to go short, he was also very much aware of the kind of poor structure that was developing above in this second shoulder. He has described that as ledgy/blocky type of highs as you can see from the first two white circles on the chart below as well as this late evening move driven by the ES (SPOO). Something that overall can be considered as a weak structure. Many times we only spend time thinking about the direction for our trade and we miss the other scenarios that can easily play against us and make our trade vulnerable.
Execution Zone Using Chart and Price Ladder
One Minute Chart
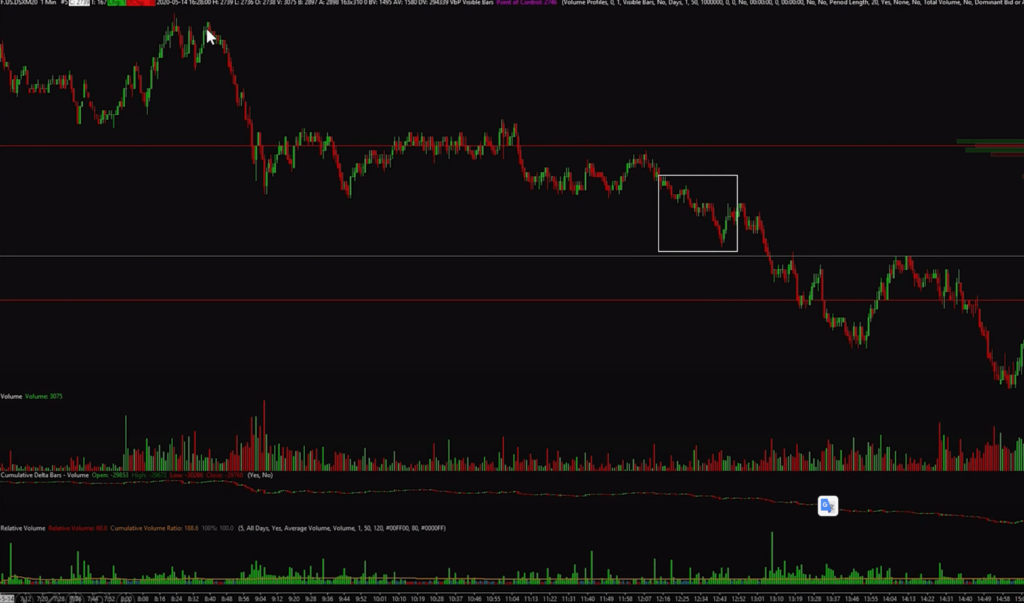
Down below we can see a one-minute chart and specifically in the white rectangle the area of the execution where we have captured the trader’s price ladder execution. At a first attempt trader actually put on a reasonable size bit earlier and covered as soon as the market did not provide the follow through the trader expected. At this point, the trader has covered a larger portion of his position and waited for a better opportunity to get short again. As he felt that really vulnerable lows are positioned at the area of the breakout, he has re-entered the trade once again and managed to re-enter with a 1000lot on a trade. One important observation was, that since he was aware that this trade is vulnerable to the upside, he wanted to get as big as possible early and capture a larger portion of the move early and not being caught quickly with a large position going against him. Now let’s have a look at the way this trader scaled out of his position on the price ladder.
Price Ladder View
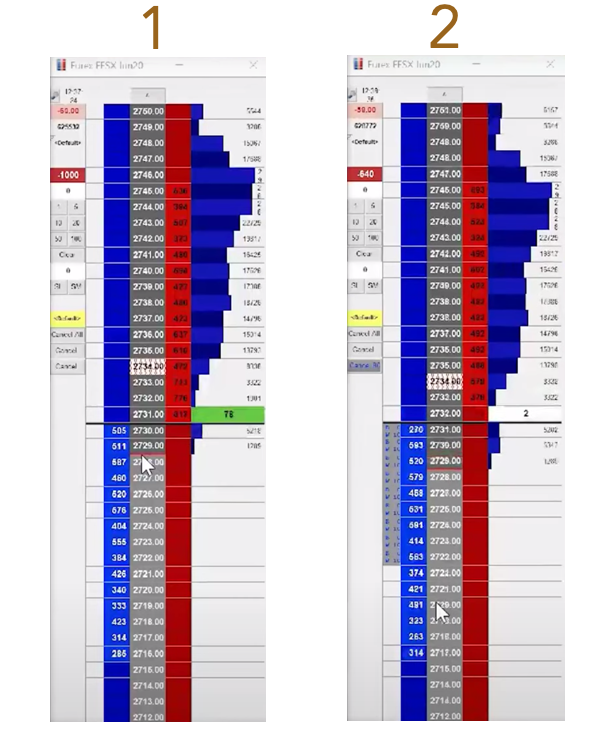
As this trader gets his full size of 1000 lots back in (ladder 1, image down below), he wants to see the market to really accelerate to the downside. Even given the conditions that EUROSTOXX market is not the fastest market in the world, he starts to cover a bigger portion of his position early. Why? Exactly for those reasons described above. That although he liked the idea of going short, he was very much aware that this position might be vulnerable given the structure and can quickly turn and against him. That’s why he is much more aggressive in scaling out of his position this early in the move (ladder 2, image down below). First, he took 250 lots off, then 100 lots. Then scattering exits of 10 lots for each price going down. As the market stops at 2722, the trader takes a larger chunk of his position passively. If you are interested in the price ladder replay, see this part of the video.
Key Trading Takeway
So what are the key takeaways for this particular trade?
- understand what makes your position vulnerable. Ask yourself a question: How the market got here? Weight in risk in a downward trending market and execute accordingly
- given the conditions of weak structure above but high conviction below, execute early big portion of your size if the market does not give you a clue to do otherwise
Understanding not only the direction you want the position to work, but also what you don’t want to see and being aware of poor structure above you can change the way of your execution. This can lead to an edge itself. Something that is many times clouded by our bias, by our one-directional expectation for the move. Something that makes us blind in our trading.
In case you are interested in finding out more about trader training to learn how to trade and explore other great trading strategies, check out our futures trading course that teaches you exactly that and more. Or if you want to really maximize your ladder execution, check out our price ladder trading course.
If you liked this type of content, you might check these videos as well:
- Large Order Sitting At The Low In Oil – Price Ladder Training
- Key Observations To Stay In A Trade – Price Ladder Training
- 3 Reasons To Get Into A Trade – Price Ladder Training
Thanks for reading and until next time, trade well.
JK