Trading Breakout Using Market Profile Structure Introduction
In this blog post, we will review how to trade the breakout trade using the market profile structure. This is gonna be an example of using multiple market perspectives such as candlesticks, correlations, time of the day, and market profile. We will break down an example of a DAX trade and explain the logic this trader used to not only enter a trade but also to manage his stop and size throughout the trade. If you are a fan of breakout trades, check out our previous post about tips on how to improve your breakout trade execution.
Trading The Breakout
Daily Market Structure
Starting from the daily chart, we have first identified the trend and the skew. When you look at the daily chart, the trend is up, and the block in which the market currently trades put on a nice rejection candle. Although daily candles are a poor predictor of the next step, they tell a story about market participants during that particular day. In this case, the tail (rejection, see down below) in the balance structure in the uptrend tells us, that buyers stepped in strongly and reversed the down day in V shape format. This gives an additional tailwind to our breakout idea.
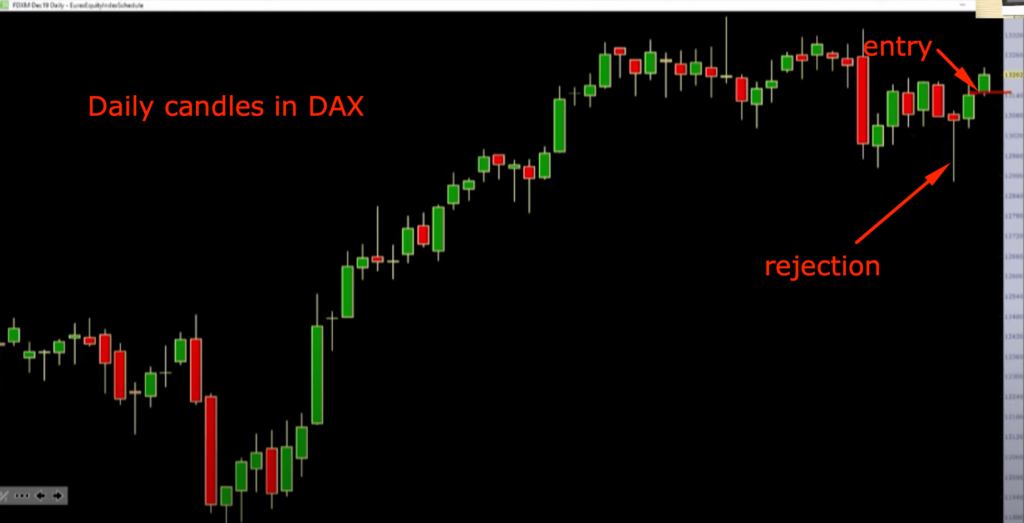
Given the daily direction, let’s have a look at market profile clues and the time of the day that played a crucial role in our breakout.
Market Profile Structure
What you see down below is the weekly market profile. Highlighted in red, you can see a VPOC of last week’s profile. But let’s ignore the VPOC for a moment. What is more important is the location of the value, time, and the skew.
You can see that majority of value has been built over the last two weeks above 131.30, with VPOC being at 131.50. For the last two weeks, we have spent both time and value between 131.70 and 131.30. The market is ripe for the opportunity. This area has been auctioned, it’s time to look for new value.
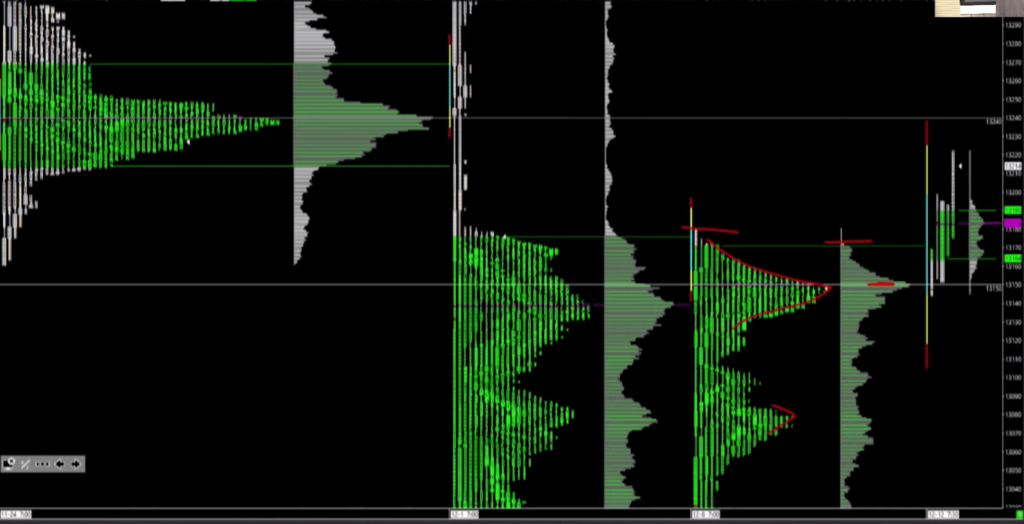
The last thing to notice that is not so obvious is the excess at the previous week low. This gives us additional skew towards the upside.
Managing Target And Stop
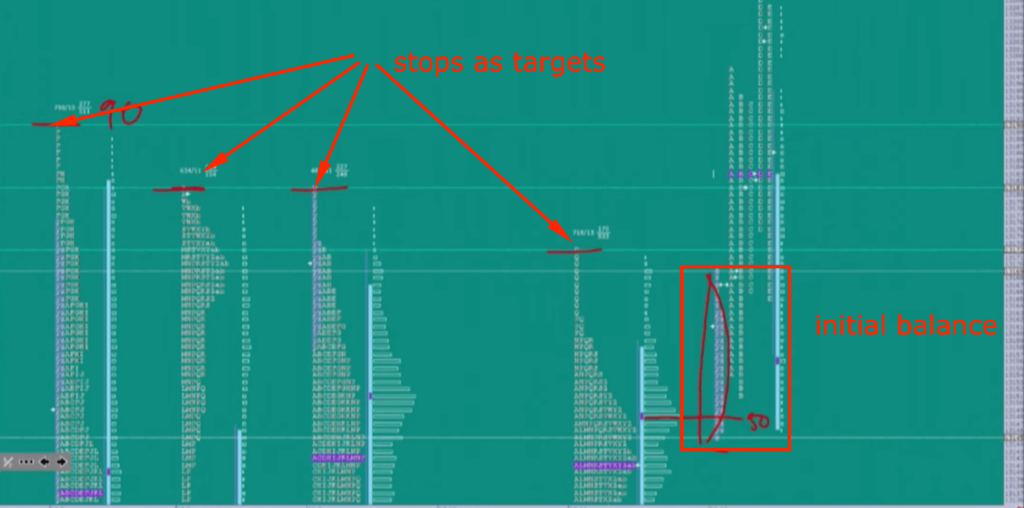
What is adding fire to the fuel are now the vulnerable highs that will serve this trader as targets. As we open, we are opening and holding above last week’s value, building an initial balance. The moment market breaks the initial balance, the trade is on.
The trader is also monitoring correlations that are working in his favor and is ready to attack this trade. The price ladder trade replay starts here, so don’t forget to check the actual trade management.
In a nutshell, this trader was aware of the rotational nature of DAX during the breakout. Therefore he was not spooked by the DAX retracing and held his initial position. The moment market started to gain traction while moving through targets, he increased his size and captured the entire breakout move.
Breakout Trade Summary
To summarise the trade, the trader relied on several clues that appeared in this trade. Specifically:
- daily structure in terms of direction and recent price action favoring break to the upside (daily tail)
- correlations – other markets supporting the risk-on character of this move
- vulnerable highs that can be attacked (daily highs tacked up together)
- initial balance value build just above the weekly VPOC
- market profile skew
After all the clues stacked up, a great trading opportunity was presented to this trader and it was all about the execution. If you want to learn how we perfect our trade execution strategies don’t forget to check the free webinar we are running at: https://www.elitetraderworkshop.com.
If you liked this type of content, you might check these videos as well:
- How To Manage & Exit A Failed Breakout Trade
- Sign Of A Breakout About To Fail – Price Ladder Trading
- Market Profile Trading: Better Breakouts with Context and Volume Profiling
Do you like what you have been reading? If you would like to improve your game, definitely check one of our courses that teach you all the techniques presented by AXIA traders from a market profile, footprint, or order-flow. If you are someone who likes to trade the news, we have a great central bank course. And if you are really serious about your future trading career, consider taking AXIA’s 6-Week Intensive High-Performance Trading Course.
Thanks for reading again and until next time, trade well.
JK