If you trade market profile day types, you’ve probably asked yourself “Is today a liquidation day or a trend day?” In this blog post, we are going to look a little closer at how to approach this question. The example we’re going to use is Eurostoxx and we’d like to try to go through how your decision is going to shift as the market develops trough the day. To start a thought process like this it’s good to sum up your knowledge with questions like:
- What do you know about liquidation days?
- What do you know about trend days?
- How do they typically develop?
That is the base you need to break down the characteristics of these moves, which will then enable you to spot them as they are happening and give you a chance to act accordingly.
Trend Day vs Liquidation Day
Firstly, let’s point out that the trend day is a very tricky thing to predict beforehand. Ultimately for a trend type day to happen you need to have larger time frame participants to come into the market. They will continue to buy or sell throughout all day and they are the ones that keep the move going. That’s really hard to predict – you practically can’t foresee that any bank, hedge fund, mutual fund, or any other large frame participant will start buying (or selling) exactly today. So it’s not about predicting the trend – it’s about identifying it as soon as possible once it starts. To do that you need to know in advance the specific characteristics which you’re going to look for.
There are however situations when you can start to think that the trend is likely to happen – particularly as you get out of an area where the market, after some directional move, has been in consolidation and you’re continuing in the same direction.
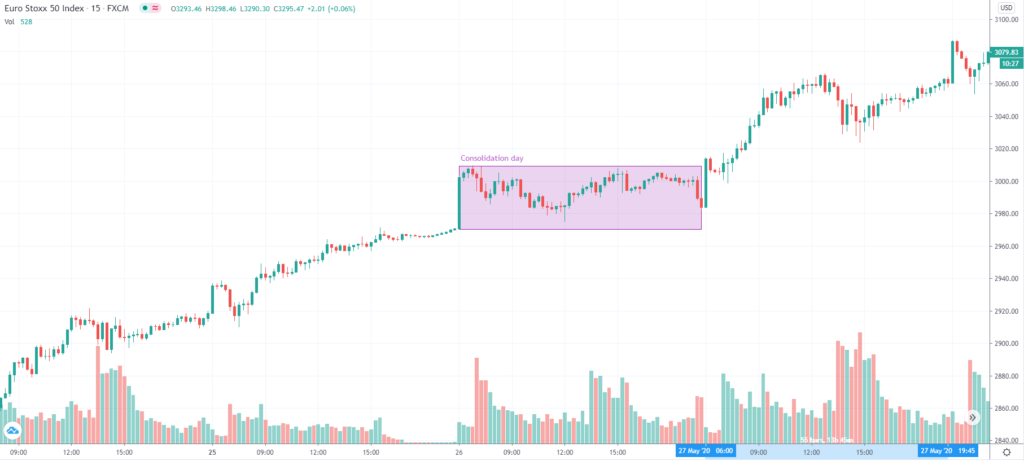
The example of that you can see on a chart above which shows European equities on a move up at the end of May. We then get a day of consolidation, after which price breaks higher on the 27th of May and continues the move in trend type fashion. This is similar to what you can notice on a lower time frame chart, where you see a move up followed by consolidation followed by continuation. Having said that, it’s not very often when we get quite a clear market structure like that, therefore we want to pay attention to the hallmarks trend type day has once it starts.
Liquidation move on the other hand is a little bit more straightforward because you are able to point out where you can expect it to happen. In advance, you’re starting to think about these possibilities and the reasons for liquidation? You won’t get liquidation if you haven’t had a phase of positioning. The phase of positioning is where the market moved to a new area people are trying to buy (or sell) to continue the move – without any significant effect. You, therefore, have positions that are trapped and with the turning will go running for the exit, triggering potential liquidation.
Key Characteristics Of Trend And Liquidation Day
The next thing is once the day starts is to ask yourself if you have any of the characteristics listed below:
Before it starts
- Small Initial Balance
As soon as you got that you should straight away think that you have a potential_for a trend or liquidation type day. The next stage of the move is gonna tell you which of the two is more likely.
The first part of the move
- Fast early move trough clear level ~ liquidation
On a fast move out of Initial Balance, especially when the market breaks any clear level – meaning, a distinct point on hourly or 15 minutes chart where you could quite easily say market participants will be forced to act, because of stops placed there – that’s an indication of a liquidation type day. You should then be expecting the adequate order flow after that.
- Absorption phases (tight range) then new push ~ trend
In the beginning, you won’t necessarily see a huge early move, but it will still have a very clear push in one direction and then it will (rather than just drop/spike very fast and stall) have phases whereas it stalls and the market will just absorb any retracement back. This will create a tight range, like a small flag on a 1 minute or 5 minutes chart, and then you’ll get another push in the same direction. This will be quite quick, however, you won’t see it continue on and on, rather you can notice selling pressure moving steadily lower and lower (or buying pressure moving higher). Market participants progressively moving into the same direction – rather than just chasing the price is a strong indication of trend type move. Each time they sell once they can’t sell anymore at these prices – they will push price further and engage with the next buyers (or sellers) they’ll find.
After recognizing the first part of the move and connecting it with liquidation or trend you take a look at:
Rotations
What happens on any movement back? Are we getting back trough the recent support/resistance? Having broken support do we stay below it?
- Rotation back trough previous short term highs/lows ~liquidation
If you see the price going through short term levels it is another indication you’re faced with liquidation type move, and you’re going to see balancing out of the bottom(or top) of the day.
- Support becomes resistance short term ~ trend
If support being broken is then used by the sellers to position short below it, you have an indication of trend type move.
Low Volume Nodes
- Low Volume Nodes getting filled in ~ liquidation
If the low volume patches that initially appeared on a ladder with the directional move are getting filled with market rotating back – you’re getting one more sign it’s a liquidation move, meaning there’s no more new selling coming down at those areas.
- Low Volume Nodes used as a support ~ trend
Approaching Low Volume patches market participants get active and move price away in the direction of the first part of the move. You can see an example of that in the EUR/USD contract continuation trade we talked about in the previous post.
Examples of Liquidation And Trend Days
In order to get a full understanding of how to use that knowledge in practice, please have a look a the video, where Richard from Axia Trading Floor explains the approach at different stages of the day developing in the Eurostoxx market.
Learn To Trade Market Profile Day Types
To learn to trade market profile day types and develop your career as an elite trader then check out our range of Trader Training courses. Our flagship 8 Week Career Programme can be attended live on our London Trading Floor or virtually from home as an online trading course. These are the most comprehensive training programmes in the proprietary futures trading industry and are based upon years of successful in-house skills development.