Cumulative Market Volume Delta Introduction
As traders, we are constantly seeking the edge in a market and cumulative market volume delta (volume delta) is yet another clue that can help us perfect our edge. In this article, we will be looking at what the volume delta is, what does the “cumulative” stand for, what does it indicating and what are the implications. Context is crucial, something we repeat a lot in our content. Once you understand in which context can be market volume delta particularly useful, you will be able to use this indicator in your own strategies. Like for example in the DAX trade explained by one of our traders.
We will be using some examples regarding the volume delta from the video down below, where one of our traders explains different contexts in which delta was used and how it was interpreted.
What Is Volume Delta
In order to understand the volume delta, let’s have a look at what it is. Essentially it is composed of two main entities: net buying at market price and net selling at market price. What does it mean? It means, that volume delta is measuring (by volume of trade) which side (buyers or sellers) is more aggressive in terms of taking the current market price. It measures the degree of intent by buyers and sellers. This information tries to answer who is more dominant. Is it buyers lifting the offer or sellers hitting the bid? The word “cumulative” then indicates the total sum of this net buying/net selling at the market. If the cumulative market volume delta is rising and is above 0, it means buyers are more willing to trade into the offer then sellers hitting the bid. And vice versa, if we are below 0 and dropping, sellers are more willing to hit the bid and pay the current market price. There are in principle two main settings you can have your volume delta setup within NinjaTrader:
- cumulative volume delta
- histogram (candles) volume delta.
In our article we will be using the cumulative option since it gives a better context for our particular trades we will be talking about.
How To Use Volume Delta
There are many strategies in which we can use volume delta. Here is the list of potential strategies:
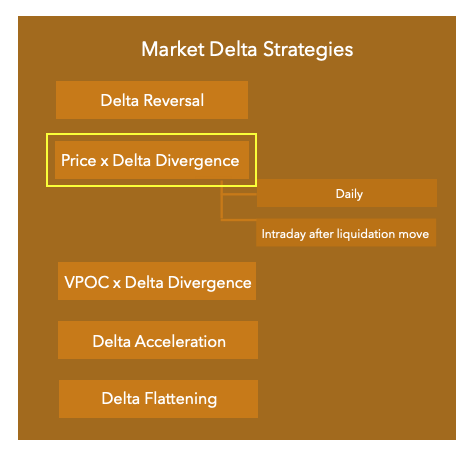
In this article, we will be focusing primarily on the Price x Delta Divergence strategy. If you would like to find out more about different strategies, check our London trading course or footprint trading course.
Different Trading Contexts Using Cumulative Market Volume Delta
In the examples below, we will look at 4 different opportunities within the Price x Delta Divergence strategy. So what this Price x Delta Divergence mean? It means, that as the price is moving one direction, Volume Delta is moving in the opposite direction. So in case of price moving down, there are more buyers willing to lift the offer at the current market price than sellers to hit the bid. It is telling us, that buyers are happy to pay a higher price even though the market is going against them. If this trend is dominant for some period of time, it is a clue that when the price stops moving down and dynamics of the participants shift from sellers being dominant to buyers being more dominant, we might see buyers driving the prices to a new extreme.
Each example below makes sense within it’s context and gives you a clue what might happen next.
Divergence In Price x Cumulative Market Volume Delta In A Bullish Context
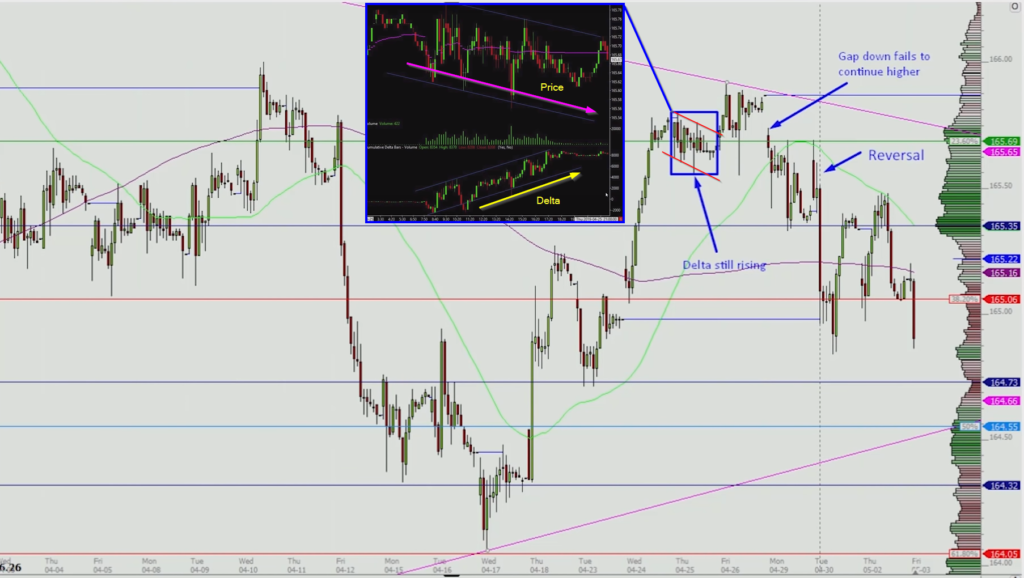
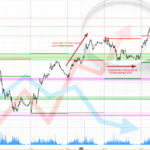
In this example, we can see a Price x Delta Divergence happening within the recent bullish trend. As you can see in the black box above, as the price is moving down within an intraday channel (pink arrow down), the Volume Delta is rising (yellow arrow). This move creates a bull flag on an hourly chart. Understanding what happened within this bull-flag (Price x Delta Divergence), can give you a clue into the next day opening. The next day market moves higher.
Price x Delta Divergence Pre-Breakout
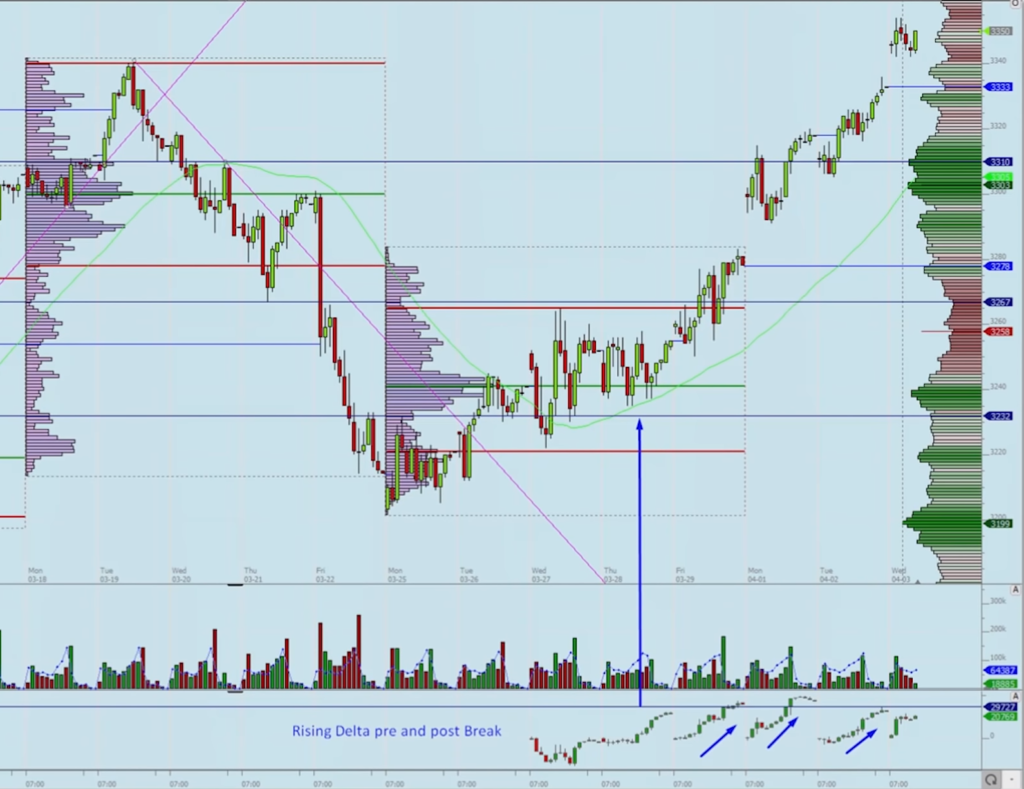
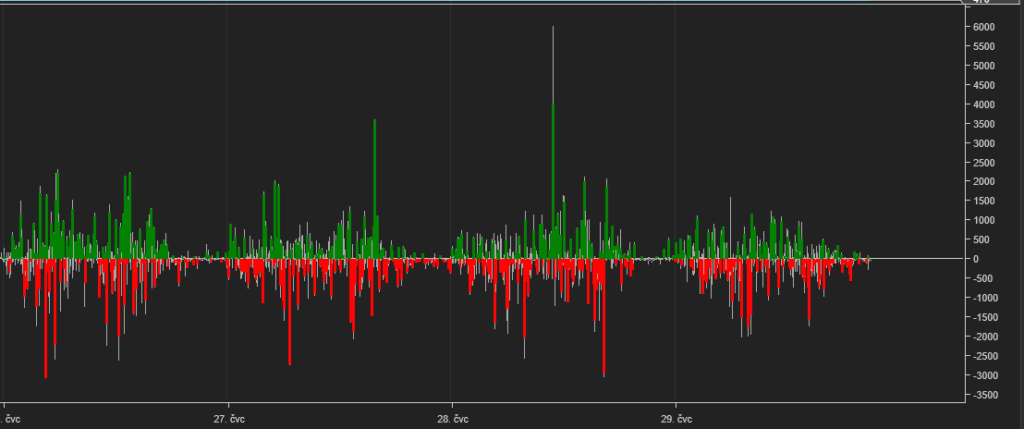
In this example, we can see as the price stalls pre-breakout, Volume Delta was rising and after we broke, it continued to rise. This pre-breakout rising Volume Delta and post-break rising Volume Delta could give you a clue to hold on your trade throughout the next couple of days.
Price x Delta Divergence Pre-Fall
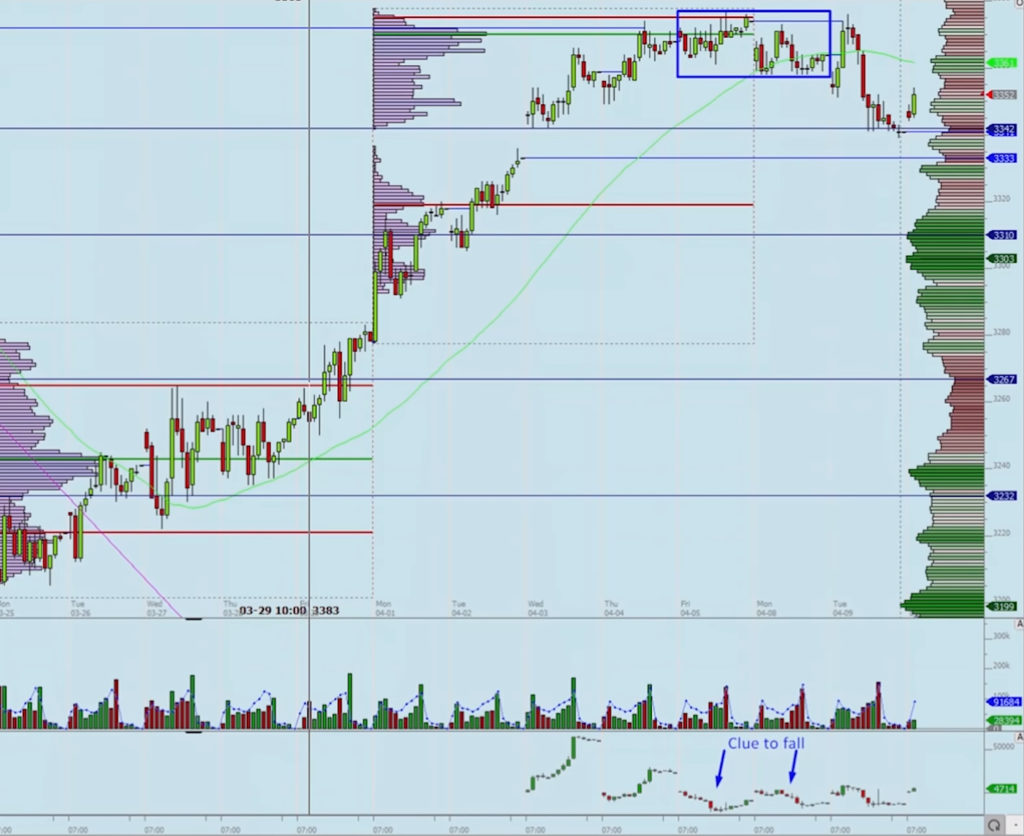
In this example, the market was trending for a couple of days and now reaches a moment of consolidation. In the consolidation period, Volume Delta started to fall and was not as high as the days before. This was a potential clue, that market is set up for a correction after several trend days.
Price x Delta Divergence After Liquidation Move
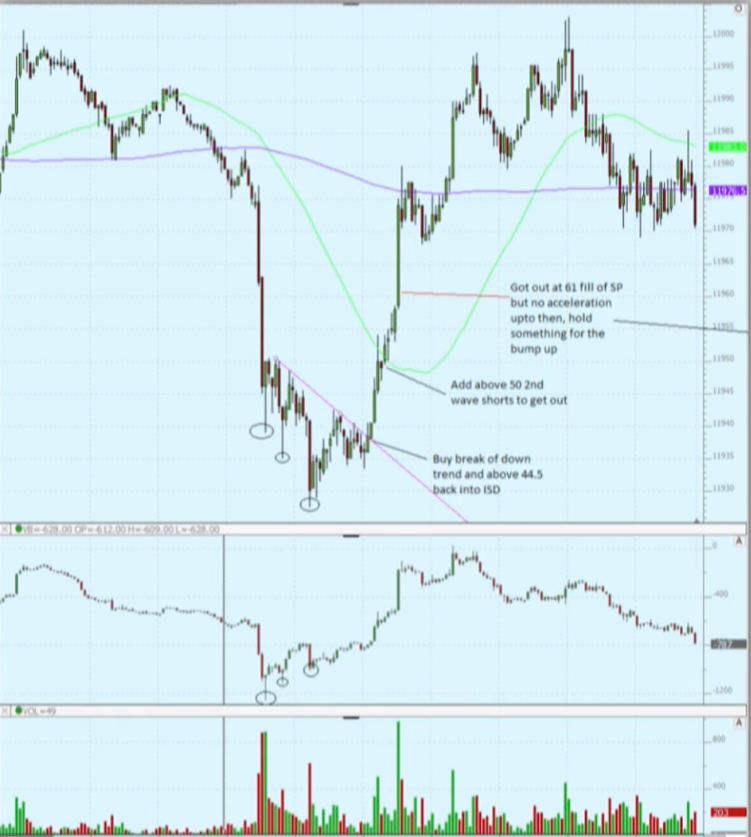
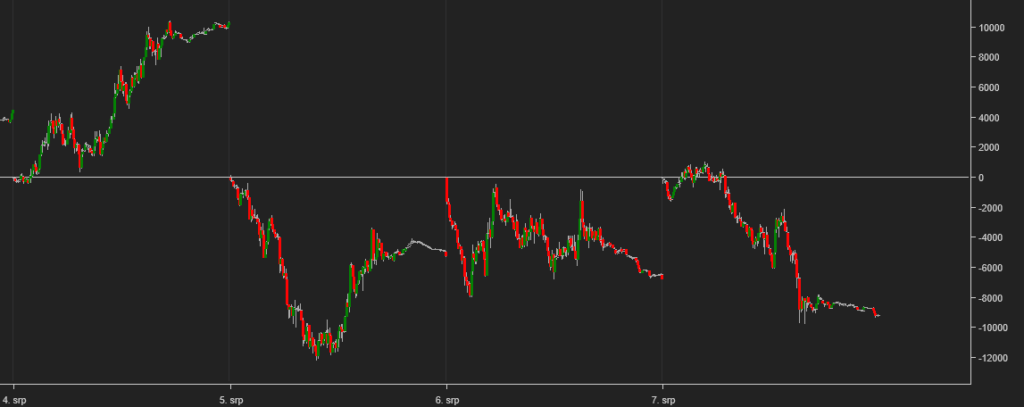
In this intraday example, we can see a fast liquidation move. As the prices are moving down after the liquidation move, the Volume Delta is not creating new lows with prices making new lows which leads to Price x Delta Divergence. This can be a signal, that the move is over. Using an intraday down trendline, you could buy the break of this trend and hold as long as Volume Delta was rising.
Summary
Volume Delta can be a powerful tool not only for the identification of a trading opportunity but also for your trade management. Understanding the context and reading Volume Delta throughout the day can give you an extra conviction in your trades. An important thing to remember is that it is the intent or willingness of market participants to take either higher or lower market prices. As with any market clue, it is only a nuance explaining the dynamics between buyers and sellers and always needs to be put into perspective like the one we have explained in this article.
In case you are interested in finding out more about trader training to learn how to trade and explore other great trading strategies, check out our futures trading course that teaches you exactly that and more.
If you liked this type of content, you might check these videos as well:
- The Biggest Mistake Traders Make With Market Delta
- How To Track Accumulation With Delta & Passive Orders
- How To Trade Delta Reversal Strategy
Thanks for reading and until next time, trade well.
JK