For new users the studies interface in Sierra Chart can look quite daunting. This is especially true of option dense studies with lots of user information such as the market profile, volume by price and the Sierra Chart Footprint. Many new users end up having to jerry-rig their own footprints, scraped from different sources, slapping on some new paint and hoping that it works well. As always, breaking things down and reverse engineering is a powerful learning experience and it is just as useful when it comes to making the Sierra Chart work for you.
As such, we will do the same here in this blog. While we will be unpacking the technical aspects of using the Sierra platform, it’s worth noting that we also offer a complete course on Footprint Trading Strategies. That said, let’s dive in.
The first part of this guide will take an existing footprint and break it down so that you can understand the different choices made when creating a footprint chart and its final results. This will be done intuitively with descriptions along the way.
The second part of this guide will then be more linear and intended as a reference. It will go over the footprint study settings so we know where to focus most of our attention and where to find all the ‘fiddly bits’ that add more quality features to your footprint chart.
Do note, the second part is not wholly inclusive of all settings. Only the most relevant settings to beginner and intermediate users will be explained. A quick search within the excellent Sierra Chart documentation on their website is always a best practice when you are trying to uncover a niche setting.
NB: The footprint study in Sierra Chart is referred to as ‘Numbers Bars’
Part One: Understanding the Sierra Chart Footprint
I will start this guide by specifically addressing new traders who are also new to Sierra Chart.
A usual pitfall for this group is that they first load up the footprint settings and attempt to assemble a chart that ‘looks good’. To put it another way – there is no intuition behind what data they want to draw from the market and how to organise it effectively for edge. In essence they are hoping the settings will ‘show’ them something with ‘edge’ straight out of the box.
This creates two problems. The first is clear – disappointment and skepticism due to not finding footprint charts useful. Secondly, this mentality severely hinders effective and logical footprint construction from the ground up. This group usually finds the many choices within the settings overwhelming because they don’t know what to exclude from the footprint chart.
Therefore, the correct way of getting started is to design a footprint around a specific activity or order flow that you have intuitively noticed and understood yourself without the need for a footprint chart. Next, you should start to piece together the footprint chart by building it specifically to help you with that basic observation. Ask yourself “How would a footprint chart best be built to filter for this data? What would be the most effective and cleanest way to display this?” And so on.
In essence, to build a useful footprint chart you must have: Observation > Idea > Footprint build > Edge (or enhancement)
This is in direct contrast to the error mentioned previously where new users expect:
Footprint > Observation > Edge
Using the rationale above, we will use it to explain how our example footprint was built, why it has certain features and why it does not have others.
Building the Sierra Chart Footprint
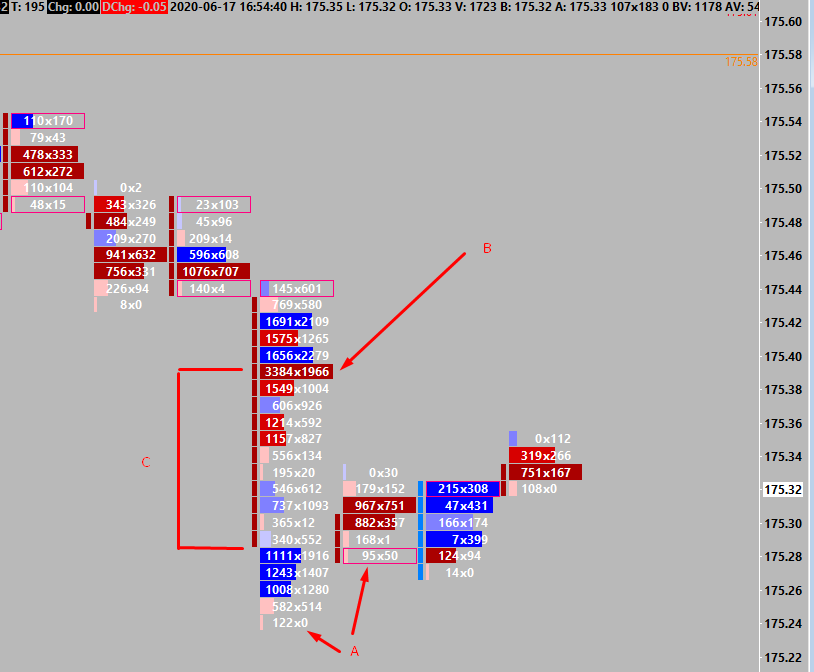
This footprint was built to clearly display several order flow observations that have an impact on decision making.
A – Highlight of finished and unfinished auctions.
B – Red colouring of dominant selling at that price (hitting the bid). Volume profile also compliments to quickly spot large selling volume.
C – Volume profile as background type.
This footprint was made specifically to keep track of these three observations and later trading ideas built out of these observations.
Observation A – Fished auctions (122×0) after a protracted move would create a very ‘snappy’ or ‘flicky’ low on the price ladder. Often these created the low or bounce of a move. Inversely, contested auctions (unfinished) tend to get traded through until an actual finished auction is put in (tendency to trade back).
Idea A – Could we use this observation on a footprint to further give confidence that the move is retracing. Therefore fade the move or give confidence in a pull-back? Or could we use unfinished auctions at the high in a trendy low volatility day that the pullback is temporary and the trend will continue ?
Footprint Build– ‘Highlight Nonzero BidAsk Volume at High/Low’ (Ln:115) was turned on. Easy to spot finished and unfinished auctions.
Observation B – Strong selling at one price that generated good auctioning activity to sell lower can be retested and often prove to be a pullback high. Similarly in a breakout move lower, strong bidding could try and lift the price but gets held at one price (absorption).
Idea B – We could use these prices that stick out due to the colouring and volume shape to join or rejoin a breakout move on pullbacks. These locations often provide good risk – reward.
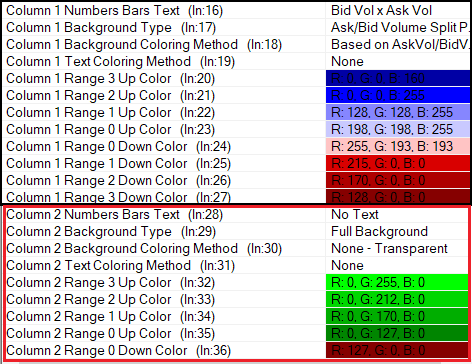
Footprint Build – ‘Column 1 Background Coloring Method’ (ln: 18) setting changed to ‘Based on AskVol/BidVol Percentage’. This setting uses percentages to determine the difference of the volume hitting the bid vs lifting the offer and colours the proportional difference.
Observation C – Different prices generate different levels of participation. On faster moves this change can be very obvious yet easy to miss during volatility. Are there patterns in this participation change?
Idea C – We could use the volume profile shape (as opposed to none or split) to show specific patterns. That we can copy from market profile and infer from auction theory to give context to future order flow.
Footprint Build – ‘Column 1 Background Type’ (ln:17). Changed to ‘Volume Profile’
This footprint was purpose build for just these three things. Therefore since we know what we want to see, it is much easier to build this footprint from the ground up and which settings are correct within the vast option of choices. As mentioned earlier, I know which options I do not want.
For example, in regards to background type. We do not want a split bid/ask profile as this doesn’t easily show the pattern or shape of the volume as we move to generate patterns. Likewise, we also do not want a full background as there is no shape to it at all. In regards to the finished/unfinished auction highlight. I added this specific functionality due to the original observation. It wasn’t added blindly for no use or reason.
Ultimately, what has this done? This footprint build has given me: clarity of data, purpose and understanding of what we want to see, and when to see it and finally provides an enhanced edge for order flow trading.
Part Two: Footprint Study Settings
The core logic of the footprint settings in Sierra Chart is based around 3 Columns:
Correspondingly, they appear on the chart like so:
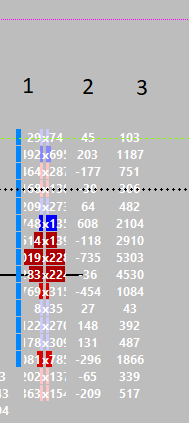
Any changes you make to the ‘Column 1’ settings will make changes to the first column. The same is true for the other two columns.
The bulk of the work involved in setting up your footprint will be done within this part of the study settings.
Much of the time, most of your footprints will only use ‘Column 1’, while completely ignoring the other two columns. Be careful to not mix-up your settings across the columns as they will display incorrectly. Keep your footprint ‘logic’ all within one column.
It would be useful to regard the remaining columns as optional, separate and side-by-side footprints for differently composed information.
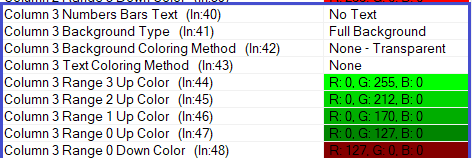
The most relevant settings here are always the first 4 options. ‘Numbers Bar Text’, ‘Background Type’, ‘Background Colouring Method’, ‘Text Colouring Method’.
Each setting has a numerical reference eg: (ln:17) or (ln:23) at the end of their name. These are ordered in the settings. For example, if this guide references (ln:100) then you can scroll down to (ln:100) in the settings to easily find it.
‘Numbers Bar Text’ and ‘Background Type’ is fairly self descriptive. The background and text colouring methods rely on ‘Ranges’. These range settings are used if you choose the settings ‘Based on AskVol/BidVol Percentage’ or similar. There is a vast amount of options here which certainly is overwhelming. However the previously mentioned setting is the most easy and simple to use and covers the requirements of most footprint charts. Otherwise the Sierra Chart documentation is a very good resource to get into the small nuances of each setting.
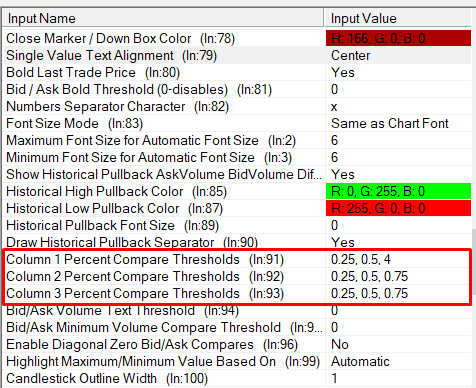
These percentages which can be set from (ln:91). By default they will be listed as 0.25, 0.5, 0.75. These 3 refer to Range 1, Range 2 and Range 3 respectively. Therefore you can adjust the sensitivity of the colouring from this setting.
The next area with ‘Pull-back Columns’ can be ignored for now. This section involves historical pull-back data supported in Sierra Chart. This fills a niche for a specific type of footprint and likely would only interest you as an advanced user.
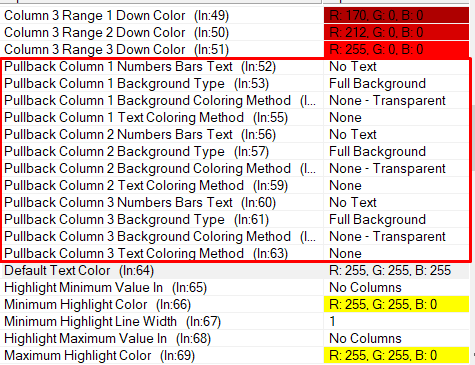
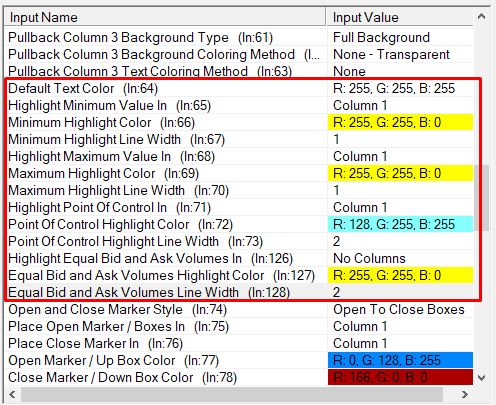
Moving on, the next area deals with highlights and text colour. The ‘Default Text Color’ deals with the colour of the footprint numbers if you don’t have a custom text colours based on bid/offer or volume change variables. This custom colour option is located at the beginning the ‘column settings’.
The ‘Highlight Point of Control’ will reference that footprint specifically. This is not the same as the daily POC. Moreover, as with all the highlights you need to choose what column to display it in. Ideally this will be in the same ‘column 1’ as you are referencing all the settings so far – to keep everything together.
The actual inputs for the ‘Highlight Min/Max value In’ where you would specify the values are further down the study settings. They are located as ‘Highlight Max/Min Value Based On’ located at (ln:99)
The next section deals with more formatting and quality of life (easier on the eyes) settings. To replicate other footprint software you can separate the Bid/Offer values with any character. ‘X’ to display 200×500 or perhaps ‘|’ for 200|500. The other settings are font sizes which is worth playing around with to suit your own preferences.
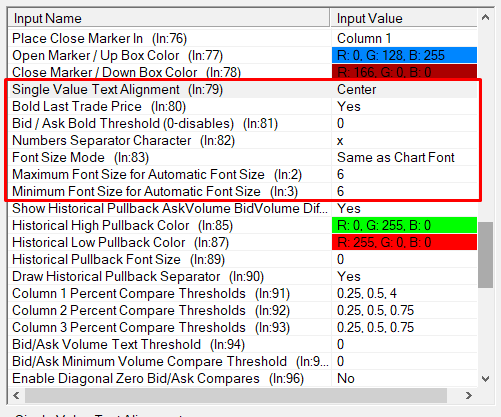
Lastly, towards the bottom of the settings you will find the percentage settings for the colouring of the text or the background. Make sure you correctly put this into ‘Column 1’ if that is what you are using and not the rest.
As mentioned previously, these are not the entirety of the footprint settings in Sierra Charts. However they will be the most frequently used and relevant for the vast majority of footprints unless they would require something niche.
Good trading to you all,
Bogdan
Learn To Trade With The Footprint & Other Advanced Tools
To learn to trade with the footprint chart and develop your career further as an elite trader then check out our full range of Trader Training courses. Our flagship 8 Week Career Programme can be attended live on our London Trading Floor or virtually from home as an online trading course. We offer the most comprehensive training programmes in the proprietary futures trading industry which are based upon years of successful in-house skills development.
Axia Futures
4 Endsleigh Street London GB WC1H 0DS
+44 20 3880 8500
https://axiafutures.com/
Social Media:
Facebook: https://www.facebook.com/AXIAFutures/
YouTube: https://www.youtube.com/AxiaFutures
LinkedIn: https://www.linkedin.com/company/Axia-Futures/
Contacts:
Demetris Mavrommatis – Co-Founder, Head of Trading
Alex Haywood – Co-Founder Head of Strategy