In this blog post, we are going to take a look at how to trade an absorption order flow pattern that preceded a move in the Eurostoxx futures shortly before the cash close.
Market Context For Absorption Order Flow
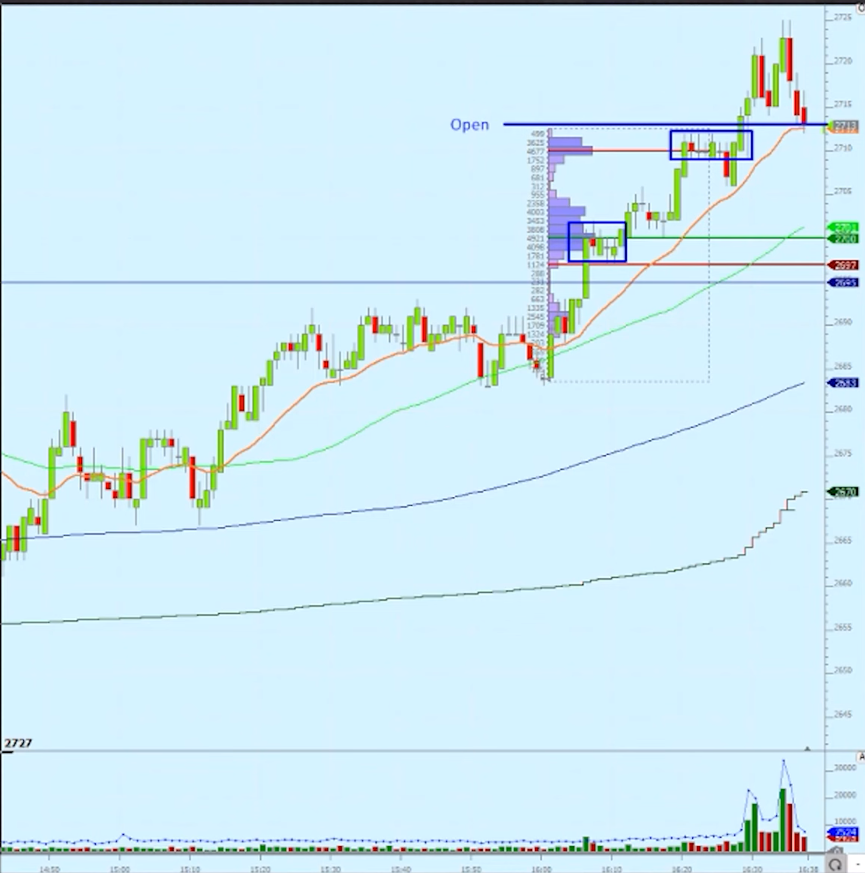
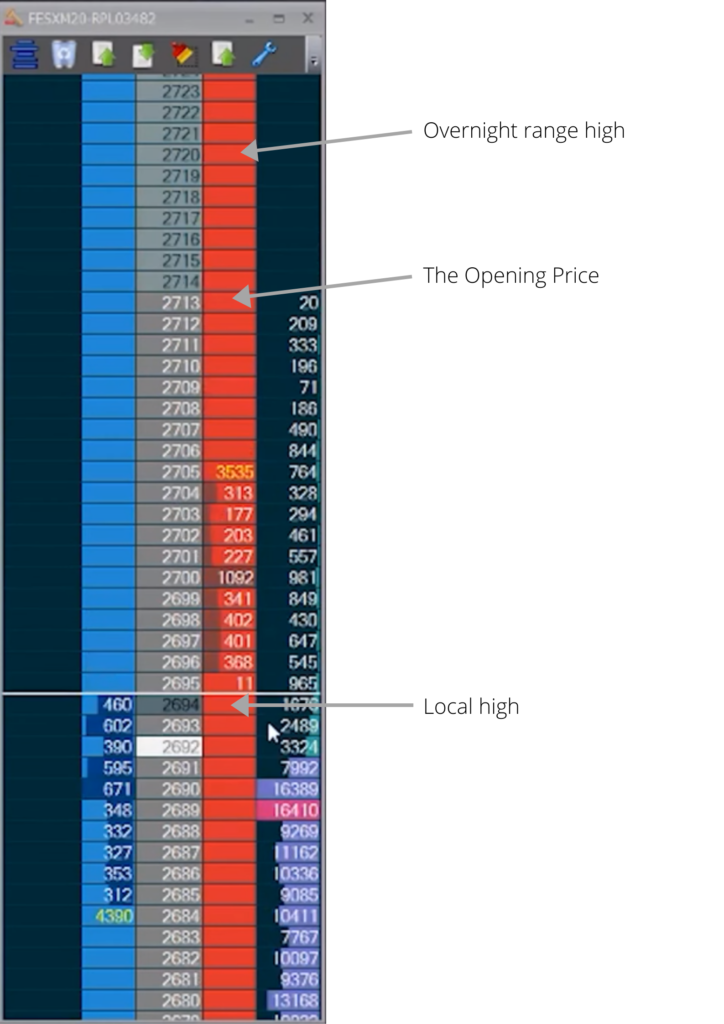
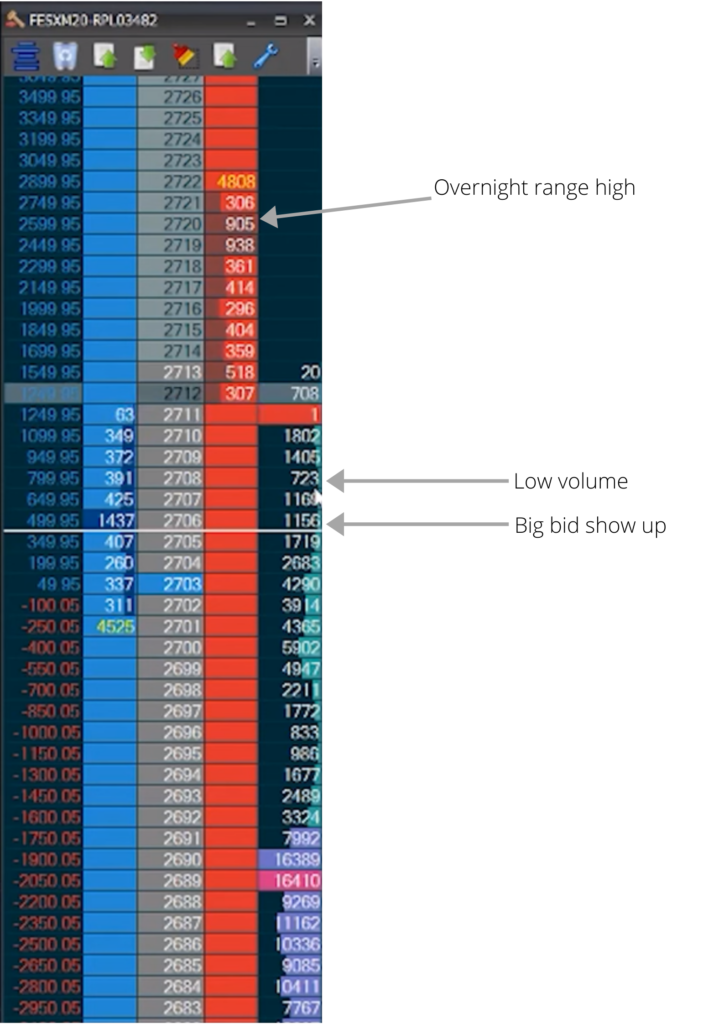
As you can see in the chart above, the market while progressing higher struggled to take the 2693 highs for some time. To give this a little context, we’ve seen pretty much open drive down on the Europe session. That first early drop prevented the price from coming anywhere above the 2700 level. Even with a quick look at the ladder, you can see the difference in traded volume, all levels close and above 2700 have very little volume traded whereas prices below 2693 have on average +10 000 lots.
Watch The Absorption Order Flow Pattern Replay
Unpacking The Order Flow Patterns That Followed
After breaking 2694 we can see a strong impulse to the upside on the back of already trending up market. The thousand lots laying on 2700 is an additional reference point to look at – the ability to take it with conviction and speed could be yet another sign of the buyers strength. When the market gets trough it, you get what you would want to see. We do have some time to get filled around the 2700 level, and you can observe two-way trading around this area.
If you play for continuation, always ask yourself what would your risk be?
The sign for you that buyers lose their power would be around 2695 levels where there’s a patch of low volume – a place where you could notice strong bullish initiative before. Coming down below there should be a clear sign that buyers back off.
However, each time sellers push the price below – to 2698-99 area – buyers immediately lift the offers up. This two-way trading absorption often builds another block for the price to move higher, as the people who sell around these levels will probably retreat as soon as the price gets even closer to the highs. To build up your conviction, you can also have a look at the correlating market E-Mini S&P 500 that at that point was pushing higher as well. The time spent there leaves you with a decision if you want to get in with all size at the “battle zone” area or if you want to hold your initial position and then add with the next push above 2702.
Throughout the move slowly progressing higher pay attention to where price rotates back to. In this example we see that after initiative moving higher the absorption levels get higher along with it, meaning that when buyers move trough 2701-02 sellers are not able to progress below that prices. Watching all these little clues pays off here as it enables you to hold to your position and manage big size with more patience.
Your targets are the levels close to the opening price, where there’s a chance that sellers could show up again, and then potentially high of the overnight range.
Watching the rotations you’ll notice that coming closer to the highs buyers now absorb 2710, and with low volume at 2708 and big order 2706, you have another reference points to watch if you want to hold on to this position. If 2710 will go offer and starts trading price below that could trigger some change in price action and short term selling. The original position is still fine, especially if we don’t see initiative change with large volumes selling into 06. We do eventually see a little dip to 06 but after that, it gets picked up, and with no more sellers at 2710 it’s breaking the highs with conviction and giving you a way out around 2720 area.
How To Read Depth of Market with Order Flow Trading
What really played a role in this trade was recognizing where the selling was coming in and noticing the clues in the activity – that selling could not hold on and steadily started to back off with buyers hitting higher and higher prices.
If you want to develop your skills of trading price ladder and see more examples of how to read Depth of Market to build your edge make sure to join our newsletter and check out our Price Ladder and Order Flow Strategies Course.
Learn To Trade Order Flow & More
To learn to trade order flow and develop your career as an elite trader then check out our range of Trader Training courses. Our flagship 8 Week Career Programme can be attended live on our London Trading Floor or virutally from home as an online trading couse. It is the most comprehensive training programme in the proprietary futures trading industry and is based upon years of successful in-house skills development.