Trading The Multiweek Range Gold Breakout Introduction
In this Part II. of the “trading the multiweek range gold breakout” post, we will review the execution of a Gold trade done by Harry. In Part I. we have focused on the prep leading into the trade. We have discussed the structure and use of the market profile tool to time the trade. In this part, we will be focusing on the actual trade management and derive lessons from the overall trade. We will be discussing the price ladder and the way Harry scaled into his trade, the size he was clipping, and how he overall felt managing his trade.
This article is based on the video made by Harry down below.
Overall Structure Leading Into The Trade
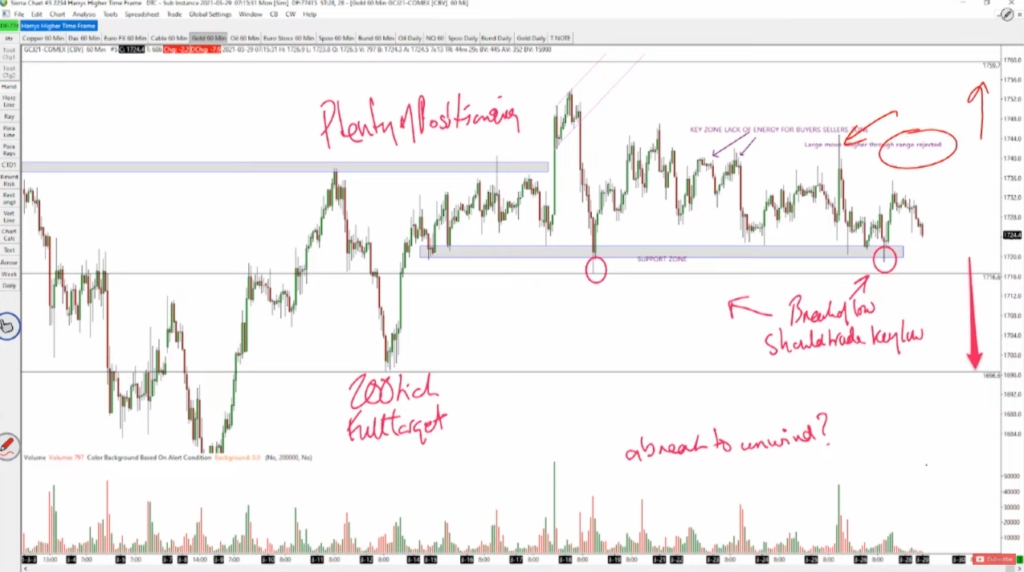
To understand the reasoning behind selecting this trade, please read Part I. – Market Prep And Structure. For context purposes, here is the landscape leading into the breakout. Harry is eying on a short trade in Gold, going for a breakout and targeting the vulnerable low 200 ticks away.
Trade Execution
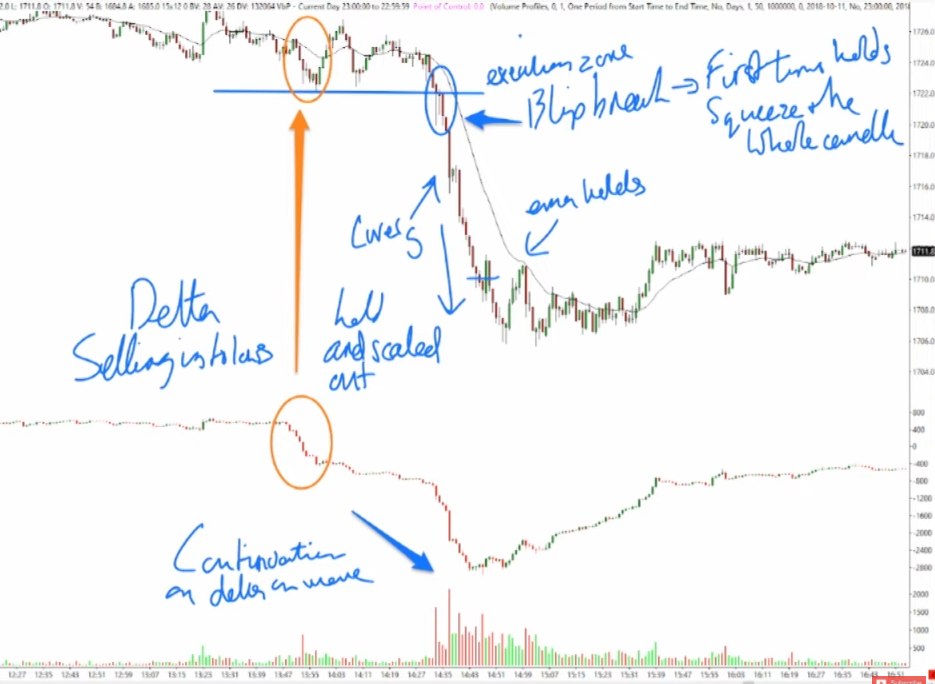
What led to the breakout was the positioning prior to it. If you jumped in after the first break lower (orange circle), you got burned a bit but that is part of participating in the opportunity. Sometimes we wait for the perfect setup, additional clue, every single checkbox to be checked, wondering if this is the time. It is our fear of loss, that is preventing us from taking the opportunity. Being burnt the first time was an opportunity fee to pay. Delta confirmed the break but the most important aspect of this false break was what happened after. Positioning short. Not V reversal. No spike and run higher. Flattening towards the lows making the lows even more vulnerable. Next time it breaks, you must take the trade again! Let’s deep dive into execution.
Trade Management
Starting with execution, Harry was aiming for 97 to be a trigger. The video trading on the price ladder starts here. Prior to 97, there is this jump in price action that led Harry to clip the first small size, starting with 1lot. Trying to avoid pre-empting, while watching the risk-on flows in Spoo (/ES), he was willing to start with a smaller size. After his first entry, the reaction was very similar to all previous instances. Lack of follow-through and a constant squeeze of 20-30ticks. While watching the candle that broke lower, there is a location where he is ready to cover. The higher volume zone above 29 is the zone to cover if the squeeze continues higher. In this instance, it is a good thing he anticipates not a rosy ride, but he is having a realistic view of how the market can move from here. This is a very important aspect of trading when the trader has a conviction on the move and understands the dynamics of how it can get from entry to target. From A to B.
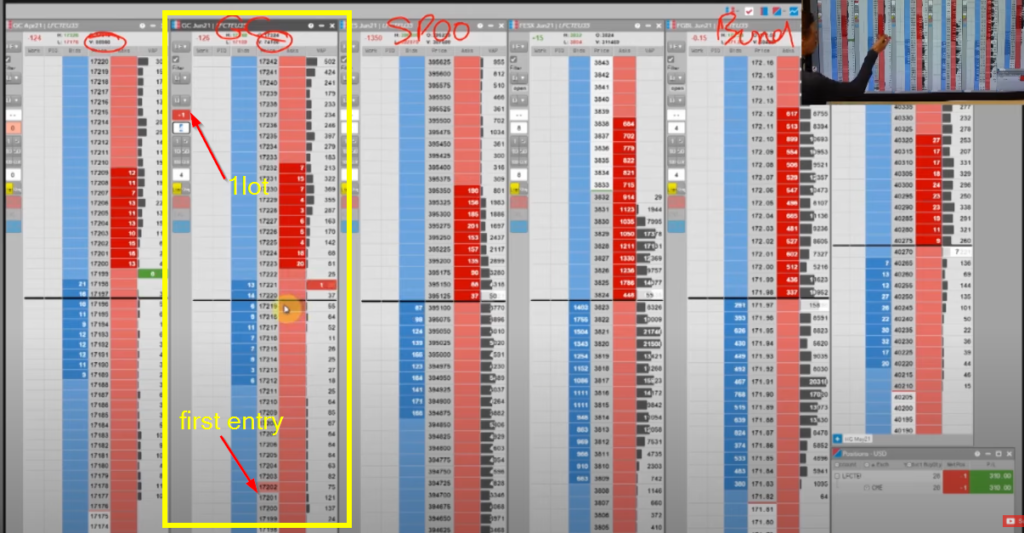
While the 29 is holding, Harry starts to observe the reloading on the offer. Every time we come back to around 17ish, reloading occurs and he is willing to add size there again. He is constantly setting expectations for the next move. For example one of those expectations is that for every strong initiative 1min candle, it takes 4 or 5 minutes to work the area before making another move. As he is increasing his size, he is surprised by the thickness of the ladder on the bid. One particular thing that I want you to notice is his mouse cursor. As he gets to 5lots, he is constantly hovering with his mouse around the bid in case he will be forced to cover quickly. He understands where his invalidation price is, constantly making mental updates after the next moves happen.
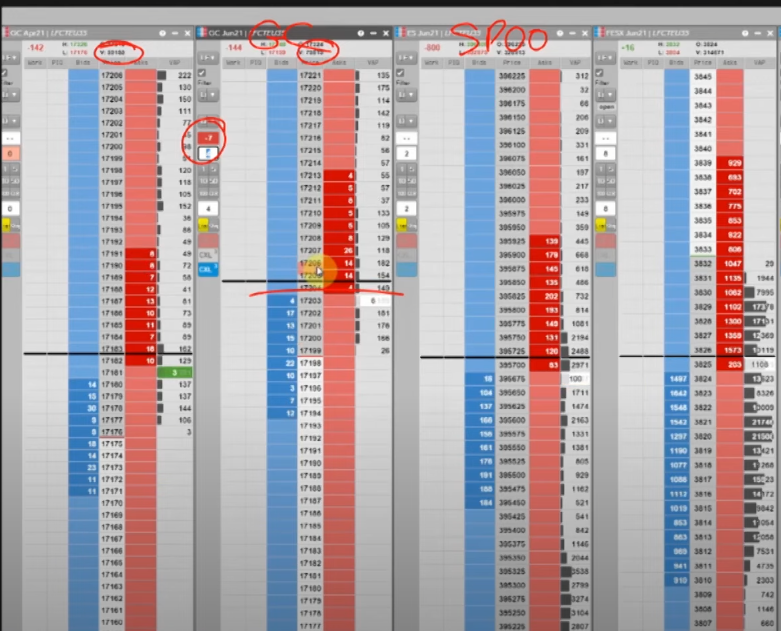
As he has 6lots in, his confidence increases with the fact, that we came back down again and we are starting to hold near the lower prices. At the 00s 40 lots keep flashing and the fact that we are absorbing here is a sign that if we stop absorbing, there is a potential for the unwind move lower. As we move through the 00s, the offer starts to get sticky and Harry is willing to add more size into the move. We are finally making a move that validates the idea. Far from a straight line move, but on a track towards our objective.
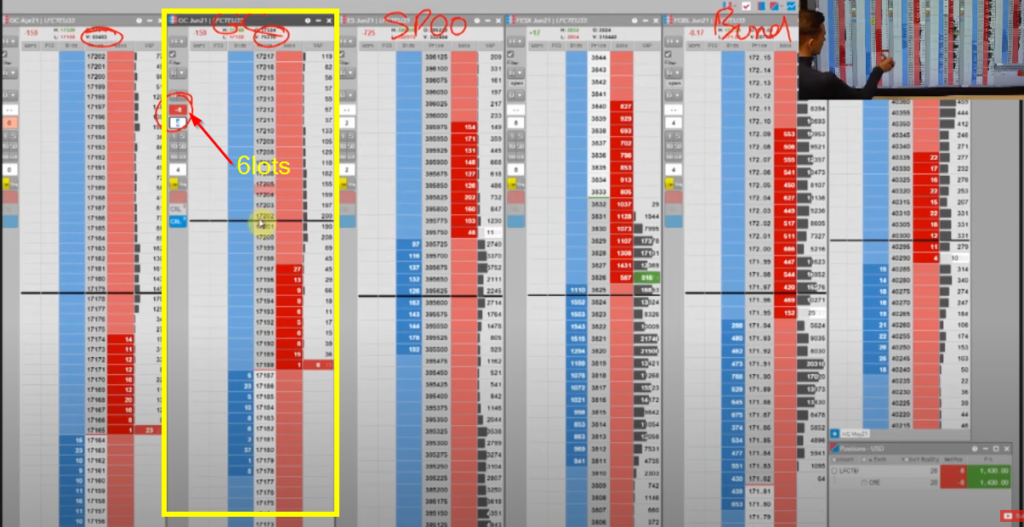
At this point, after the break is being confirmed by the follow-through, relative change, and volumes, Harry acknowledges after watching the replay, that this was the time to get bigger and get the position to 16lots because he is now in his high conviction zone. He was worried that the average position would be brought much lower but as he says, this was the time to pile in and get bigger. Along the way, the size of the bid was decent but the offer kept being sticky. Good sign, that buyers are just not willing to aggressively buy and sellers are happy to absorb any buying.
As the trade progressed lower, Harry is willing to hold his core position longer, he is not panicking because he has a high conviction that there is simply just much more to unwind after such a long time of compression. This is a great lesson for all traders. Many times we tend to panic with any two-way auction happening during our trade, we are caught in a moment, forgetting that in order to turn around the move a massive buying would have to occur. To turn direction at this location, after such compression and unwinding simply requires more time and much more buying power, therefore there should be no reason to panic. Easier said than done, but it is important to have these reminders at the front of our minds when fear starts to creep in.
Key Trading Takeaways
Here are some of my bullet point observations that stood out for me:
- relative comparison each time we have traded near the breakout zone both from the price action (minute chart bar) and price ladder perspective
- identifying the difference in relative price action once we broke and started to hold
- every rotation that starts with initiative needs some time for two-way trade before moving lower
- reloading and stickiness at crucial price junctures helping you to stay in the trade
- correlations and risk-on mode supporting your trade direction (Gold short)
- adding more size at the high conviction zones
- understanding the A-B (entry-profit) move and setting the right expectations for the move
- constantly reminding yourself the scale (technical importance) of this trade that improves your ability to hold onto the trade
Here is the summary from the debrief from Harry:

If you liked this type of content, you might check these videos as well:
- How To Manage & Exit A Failed Breakout Trade
- Sign Of A Breakout About To Fail – Price Ladder Trading
- Market Profile Trading: Better Breakouts with Context and Volume Profiling
If you like our content and would like to improve your game, definitely check one of our courses that teach you all the techniques presented by AXIA traders from a market profile, footprint, or order-flow. If you are someone who likes to trade the news, we have a great central bank course. And if you are really serious about your future trading career, consider taking AXIA’s 6-Week Intensive High-Performance Trading Course.
Thanks for reading and until next time, trade well.
JK


