Trading Fat Bottom Structure In E-mini S&P500 Introduction
In this blog post, we will focus on trading fat bottom structures in the E-mini S&P500 market. When we speak about fat bottoms, we usually refer to the profile areas that had high volume participation after a one-directional move formed at the end of the move. We can refer both to fat bottom as well as to fat tops. In our case, we will focus on fat bottoms as they provide a slightly better opportunity skew. In case you are interested in similar breakout dynamics, don’t forget to read our article Breakout Trade Management Techniques
This article is based on the video down below:
If you are interested in videos like this, watch the full video on a free two-week trial at https://www.AxiaFutures.com/
Fat Bottom Volume Profile Design
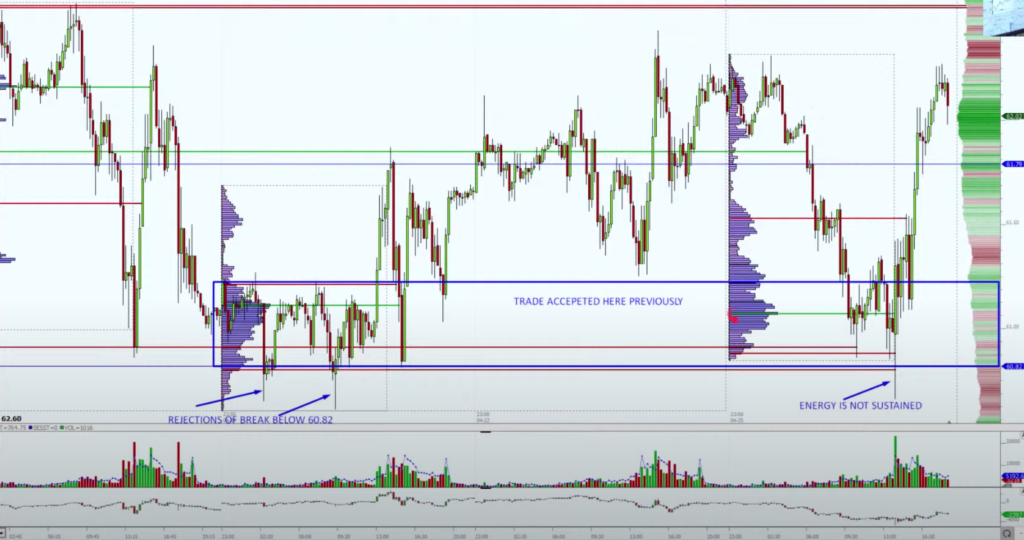
The key question we will be focusing on is how we can trade the breakouts from these fat bottoms and what are dynamics we need to understand in order to profit from this pattern. The first thing we need to understand is the mechanics of market participants at the bottom. As we were selling leading into the bottom of the move, the sellers became dominant participants. Either due to lack of buyers or through the stronger sellers. As we have approached a point, where the bottom was formed, the market started a process of absorbing creating a fat bottom. This absorption over time creates a little dilemma for the sellers. The more they sell at the lows and the market absorbs their selling, the less selling power they have. Take the analogy with 100lots. If you had 100 lots to sold and you already sold 90 and the market absorbed your selling (buyers were willing to buy from you), your remaining 10lots won’t move the market that much. Now sellers are left with a position in the market and market that is not moving in their desired direction (talking only about short-term participants). This puts buyers at a slight advantage because once the selling has been depleted, it is the unwinding of the weaker/late coming hands that need to happen for the market to reverse and for buyers to spot this opportunity.
On the other hand in order for the fat bottom to be broken, we need new energy to come into the market. Let’s have a look at three examples where the fat bottom was reversed and one example when actually new energy came into the market and was able to break the fat bottom.
Fat Bottom Reversals
Fat Bottom Reversal In Oil
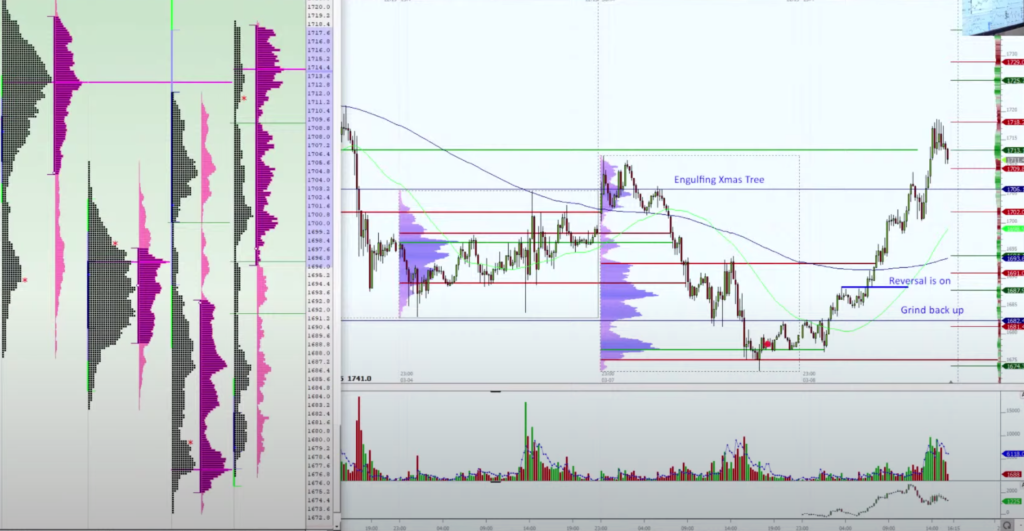
In the image above (Oil), we were dealing with the fat bottom that sellers tried to push lower, failed, and a certain amount of unwinding needed to happen. The market rallied after the failed attempts. In the Gold example (below), we can see not attempt to break and after the market absorbed the lows, it fully reversed.
Fat Bottom Reversal In Gold
Fat Bottom Reversal In E-mini S&P500
In this instance, we will zoom in on two examples of the fat bottom break each leading to a different outcome. In the first example (watch 1st attempt on Price ladder), we will see the failure to follow through lower after the break. In the second example (watch 2nd attempt on Price ladder) we will be seeing an actual break of the fat bottom and continuation lower. It is the sustained increase of energy that enabled the market to follow through lower.
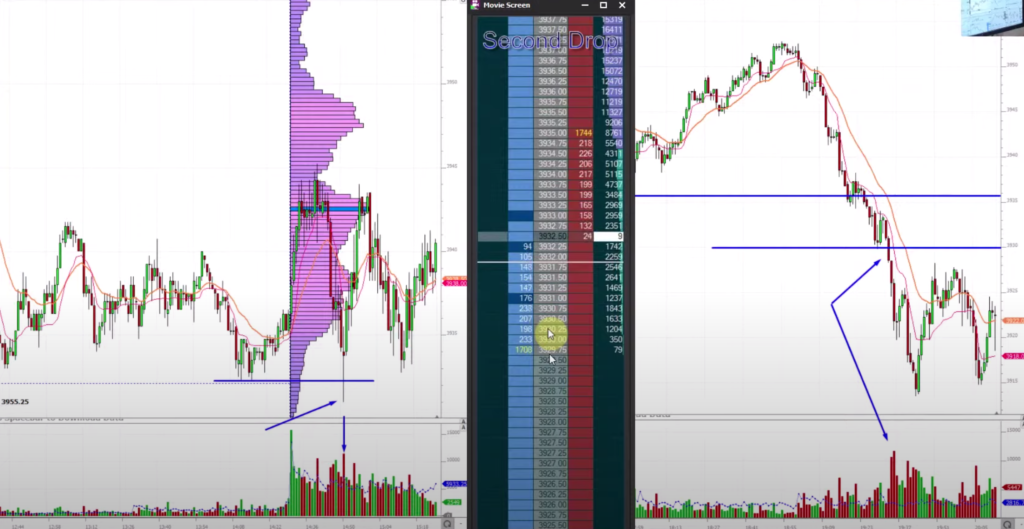
From the image above you see both attempts to break lower. If you have watched the recording of the first break and second break you could tell the difference in the change of price action. In the first instance, the market was kind of steady, with an ideal entry point below the low volume node. As we were moving lower, the market quickly changed the dynamics producing a quick whip higher. That is a signal from the price action that buyers are stepping in and sellers will have to unwind their position unless they are willing to absorb.
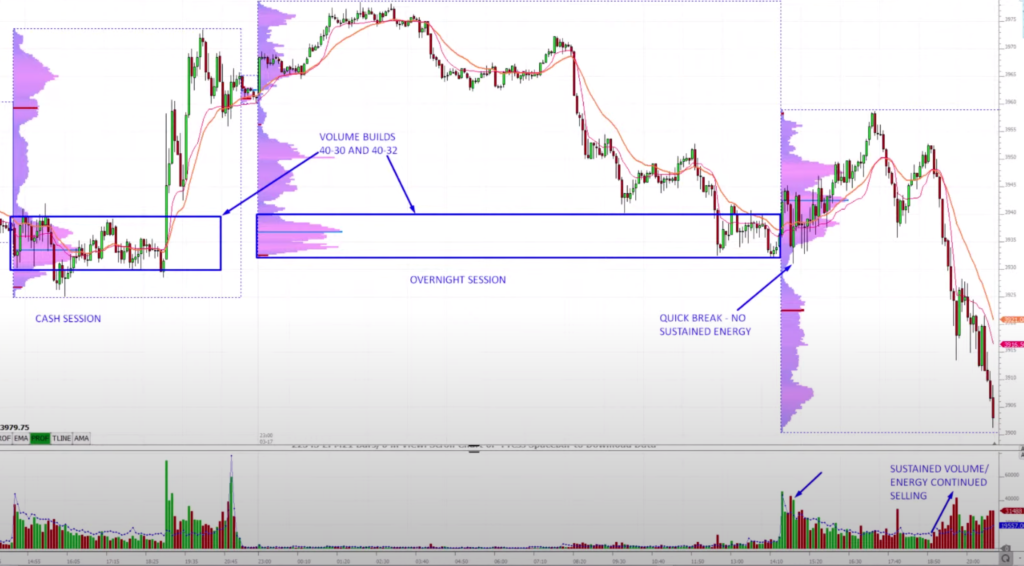
In the second example, the dynamics were different. We have mentioned we want to see an energy change. That does not have to necessarily mean a fast run through the level but in many instances a sustained move on an increasing volume. With the little flicks higher, the rotations in the second instance are not dramatic. They keep a constant pace. Reloading and form of stickiness keep the sellers in control. As we are moving lower, the volume is increasing while the selling is sustained. It is the sustained increase of energy that makes our move. Take time and rewatch the difference between the first and second attempt.
Key Trading Takeaway
The main takeaway from this post is about the fat bottom energy concentration. It is the new energy that can make a move sustainable and follow through lower. If the energy is not sustained, expect an unwind of the move.
If you liked this article, you might check these videos as well:
- 3 Types Of Price Level Breakout Trading
- Sign Of A Breakout About To Fail – Price Ladder Trading
- Market Profile Trading: Better Breakouts with Context and Volume Profiling
If you like our content and would like to improve your game, definitely check one of our courses that teach you all the techniques presented by AXIA traders from a market profile, footprint, or order-flow. If you are someone who likes to trade the news, we have a great central bank course. And if you are really serious about your future trading career, consider taking AXIA’s 6-Week Intensive High-Performance Trading Course.
Thanks for reading and until next time, trade well.
JK