Breakout Energy Change Trade Introduction
When we are talking about breakout energy change trade we are really talking about the relative comparison of a couple of market-generated information. In this particular case, we are primarily talking about the volume pick-up relative to the volume that traded on the previous occasion at a similar price zone. This energy change and the clues that led to it is something we will explore in bigger detail down below. In our previous post, we have also discussed breakout trade but we have focused on the other set of market-generated information such as order-flow speed change and Delta pickup. Check it out.
Down below you can watch the video that draws the full picture on which this article is based on.
Trade Context
Big Picture Trade Overview
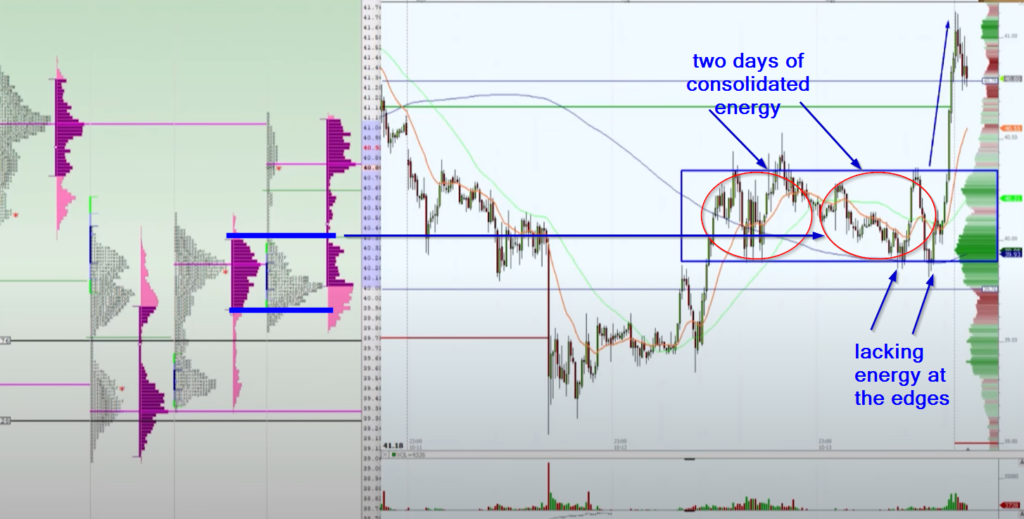
Before we get into the detail of the energy change and price ladder, it is important to understand the context. We have just reversed a most recent downtrend in Oil and we are sitting in the narrow range, consolidating after the impulsive move from the bottom. This range gives us the first clue, that we are building the energy, and given the recent trend change, we can now consider there is a higher likelihood that market will produce a continuation move higher. This building of energy is a key clue especially in products such as Oil, where breakouts can be much more aggressive once they reach a certain price threshold after a time of decent consolidation. So to summarise the clues for the upward continuation, we have:
- Market breaking higher the most recent trend producing DD day (double distribution day)
- After the change in trend, we have two days of consolidation in a narrow range
- We are looking at the product, that likes to break aggressively after the time of consolidation where energy has been built
Now let’s have a look how we could use these clues to back up our breakout idea.
Price Ladder Execution
To narrow down our focus, we know that 40.35 is a zone, where the market stopped. We now have a reference point where the market just sits for half an hour and had no energy to breakout to the upside. Given the clues behind our trading idea, we know that when we will come to this level next time we want to see the change. We want to see a change in energy. In this particular case, the energy change will be most obvious by comparing the relative volume of the first occasion (points 1 and 2 on the picture below) and our potential trade occasion (point 3 on the picture below).
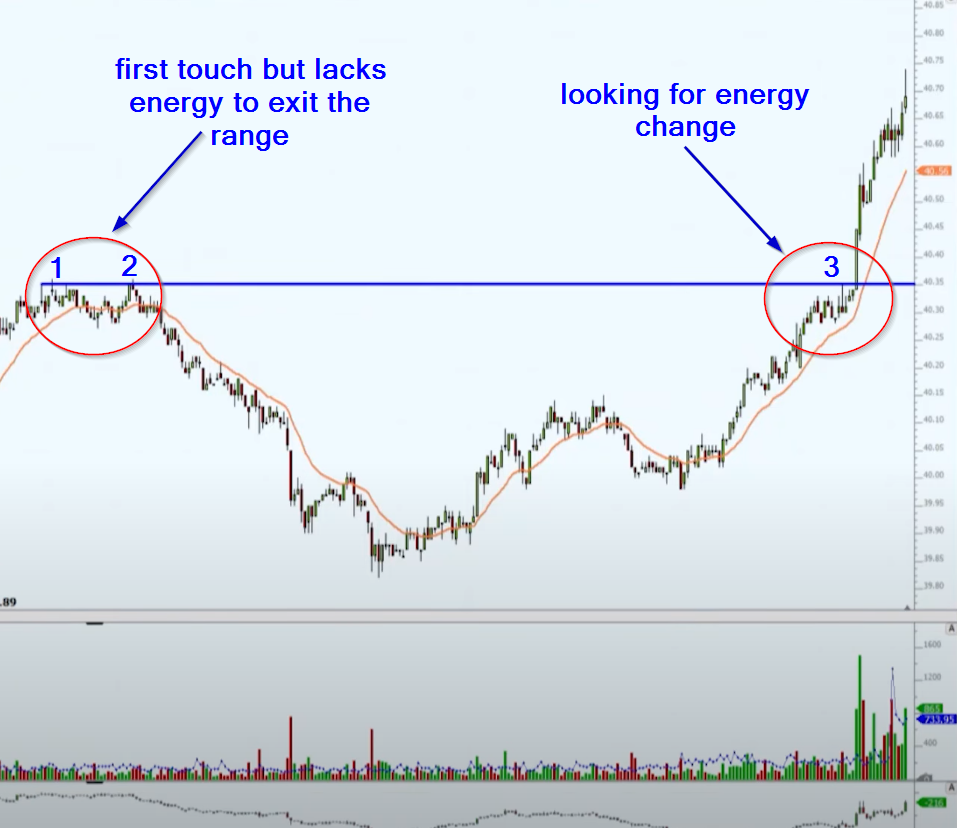
As we are approaching our 40.35 level, we know where our stop and target is. We are aiming for a move to the old VPOC at 40.80 with a stop just below 40.30. Now let’s observe the price ladder order-flow to get additional information.
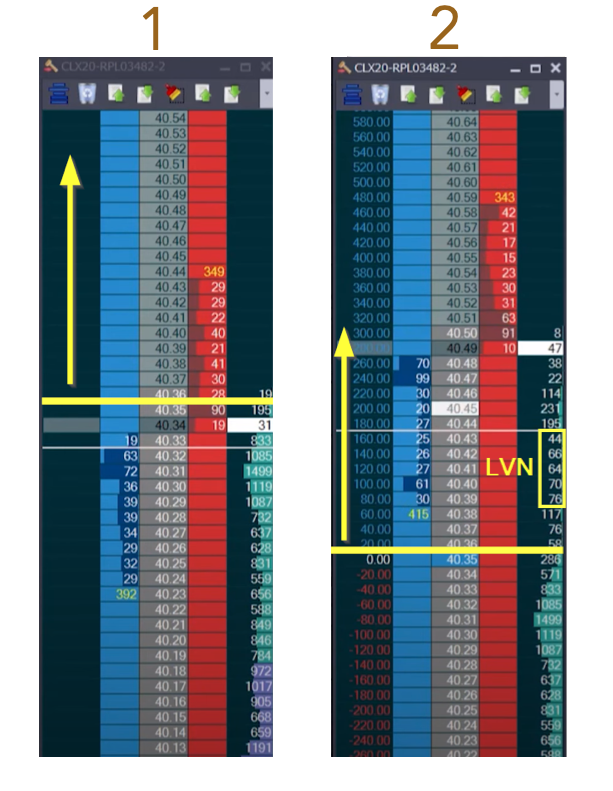
As we are approaching our level at 40.35, we want to see a little bit of change in speed. We are seeing 50lots trading into the offer. Bids are coming in, energy is picking up. Any movement back, bid comes straight back in. This is what we want to see, we want the buyers holding the ground while lifting the offer and not producing larger countermoves. We want to see faster-paced action. After we broke the 35 level, we can see a little LVN (low volume node) zone left behind us (image 2 above). This is an additional clue. If this holds, our idea has a greater chance to continue towards our target. As energy slows down a bit after the breakout, it is ok, buyers need to breathe for a bit to regain the control to start lifting offer again. We can’t expect the market will just fly towards our target. If you are second-guessing your position now, you should really ask yourself a key question: “does the selling really overwhelms the buying”, or is it just a temporary slowdown in energy. If the answer is latter, you are still good to go towards your target. You can’t expect the same level of energy all the way up. The market eventually reaches the target and that energy change was your clue to get into a trade and stay in it.
In case you are interested in finding out more about trader training to learn how to trade and explore other great trading strategies, check out our futures trading course that teaches you exactly that and more. Or if you want to really maximize your ladder execution, check out our price ladder trading course.
If you liked this type of content, you might check these videos as well:
- How To Manage & Exit A Failed Breakout Trade
- Sign Of A Breakout About To Fail – Price Ladder Trading
- Market Profile Trading: Better Breakouts with Context and Volume Profiling
Thanks for reading and until next time, trade well.
JK