The Market Profile isn’t just another tool to help establish levels, but also helps falling out of sync with your market which causes the wrong trades to be taken or mis-timing of trades and mis-management of expectations. The basic tenets of Market Profile theory are that markets will move from balanced to imbalanced and back again and also that a move is not sustainable without shifting value, therefore value needs to be established before more movement can be expected. Understanding these principles should directly impact expectations of what can happen and therefore your trading decisions and execution type. In this Blog I will walk you through how Market Profile could keep you in sync with the moves in Euro Stoxx futures in the week 21st-25th September 2020.
Market Profile Trading Strategy After Imbalance
On Monday 21st September Euro Stoxx broke from a 2 week range and trended lower for the morning session leaving a stretched/imbalanced profile – this is an easy situation to lose sync as traders may have been taken by surprise by the drop which immediately adjusts their opinion of the market to greater expectations of continuation the next day. However after such a drop balance is required and makes logical sense: New sellers will look for pull backs after a large drop, whilst more profit taking buyers appear if a continuation doesn’t start immediately the next day. In this situation most traders are passive which causes a balanced day as seen below.
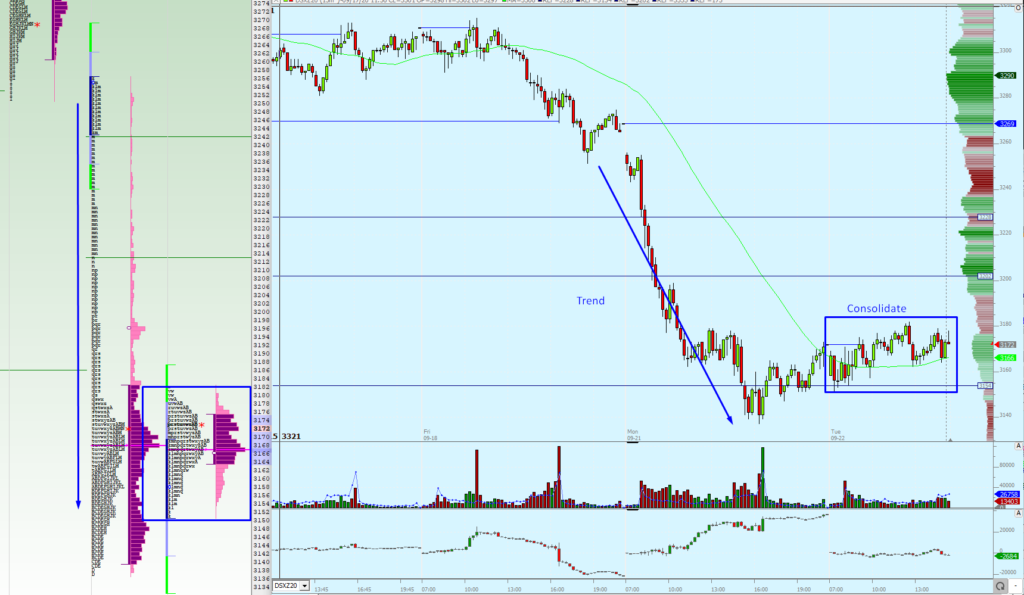
Therefore following a trend/imbalance day a passive trading strategy can maintain sync with the market – however there always needs to be a point where the strategy can be adapted – establishing points of change are crucial and this where order flow would be expected to change, here the Value Area High (78) and 52 provide points to expect change at.
Breakout Strategy Following Balance
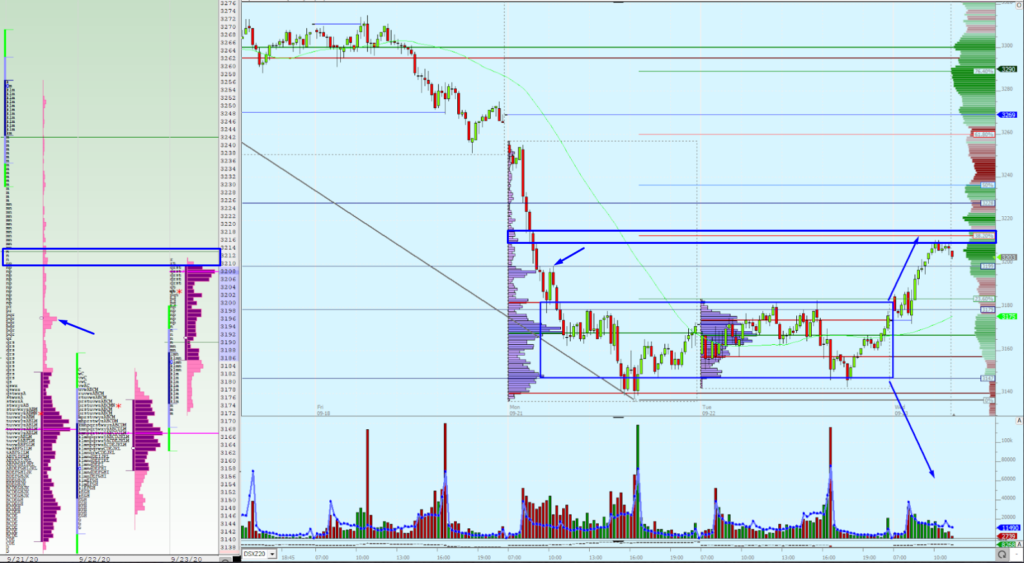
Trading Strategies can be adapted after the Market Profile shows acceptance – now initiative is expected out of the consolidation range either to reference points from the drop or a continuation to the down side. On the 23rd a break above the previous day’s high initiated a move to clear reference point targets: 97/99 high volume node (HVN) and then single prints 3111-3113. Here a breakout strategy can be employed with a bullish bias retained until a drop back into the box at which point a move through the range can be expected as value has already been built there so doesn’t need to trade again.
What To Do When There Is No Shift In Market Profile Value Area?
Euro Stoxx futures failed to stay above the box and fell through the range; again this is where synchronization with the market can be lost with traders looking for a move lower, but Market Profile suggests something different: without shifting value a continued move is not likely to be sustained – this is exactly what happened.
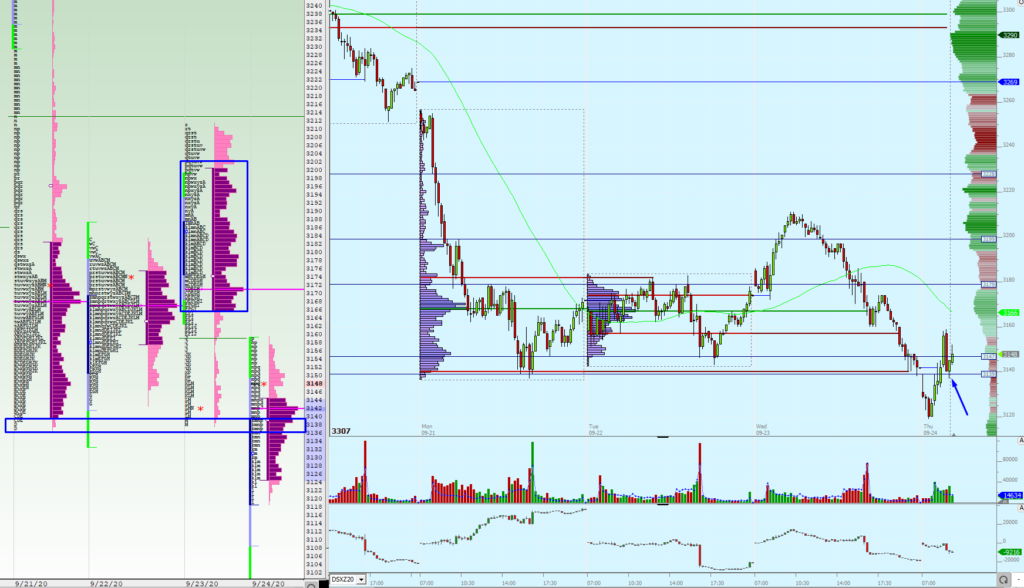
With an open below the recent lows 3137 a continuation could be played for. The continuation idea fails once trade gets into the area between the low (3137) and value area (boxed 3166-3200) and 2 way trade is likely to follow to establish value in that area – meaning once again Market Profile will have kept you in sync and adapted strategy to range bound trade between 37 and 66.
Weekly Market Profile Indicating Energy Needed for a Break
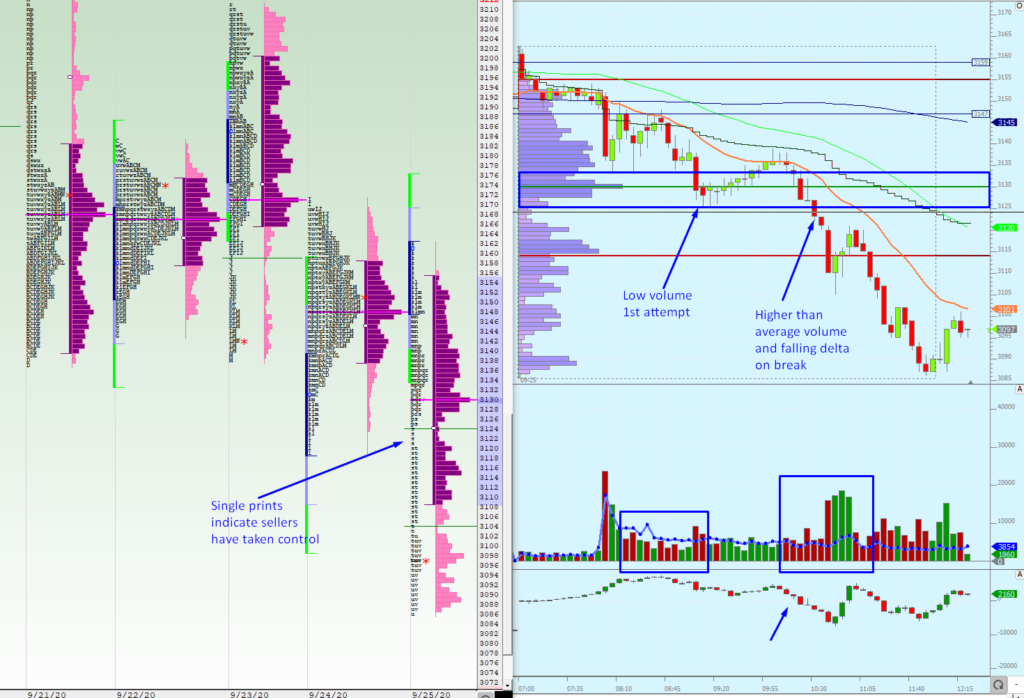
Once value had been established lower again, another leg down (imbalance) could be played for however the weekly volume profile needs to be taken into consideration. Overlaid on the chart below is the weekly profile – value is well established in a tight area (red lines 3179-39) therefore value has been accepted so much more volume is required to move away and repeat the move down from Monday. The small box 3133-26 is where the additional selling pressure is needed as this is the last support before the recent low.
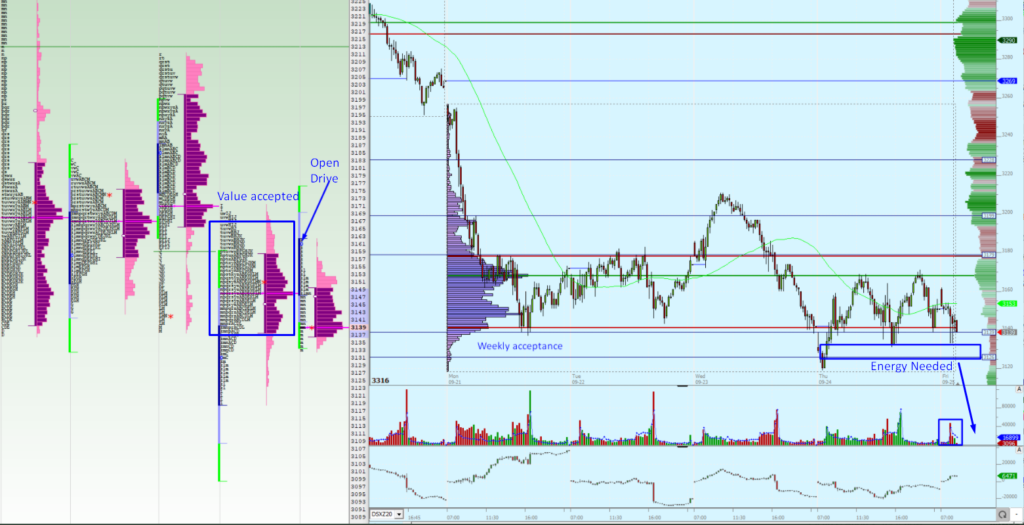
With this expectation, sensitivity to the nature of the move down into 33-26 is key – knowing more energy than normal is required prevents selling when it is not present, despite the market looking like its in the right place. Whereas when volume increases above average and delta starts to fall now is the time to execute.
Whilst Market Profile can aid you staying in sync with market movements, the real key to knowing where and when to trade is down to creating and updating, throughout the day, your hypotheses. Asking where things can change? Does the order flow justify this move? Or can the market be expected to continue with value there? Teaching and constantly refining these skills are a major part of our Career Programme that provides the foundation for our newest Axia Traders.
Richard.