Long Liquidation Price Ladder Play Introduction
In this article, we will look at the long liquidation price ladder play move. Moves like this might sometimes signal the start of the trend. This can cause a change of our bias and our stubborn willingness to keep trading in the direction of the trend even though this move has been only one-legged liquidation type of a move in one direction that will be fully reversed. If you would like to understand how to differentiate between trend day and liquidation day, check our article that introduces this concept or article that deals with a trend day specifically.
Also, check out the video below that explains the nuances we will be talking about in this article.
Long Liquidation Play Example
A good liquidation type of a move happened recently in EURO (6E). Let’s have a look at the context of the move and how the move resolved itself after trading at a key line in the sand at 1455.
The Trade Context
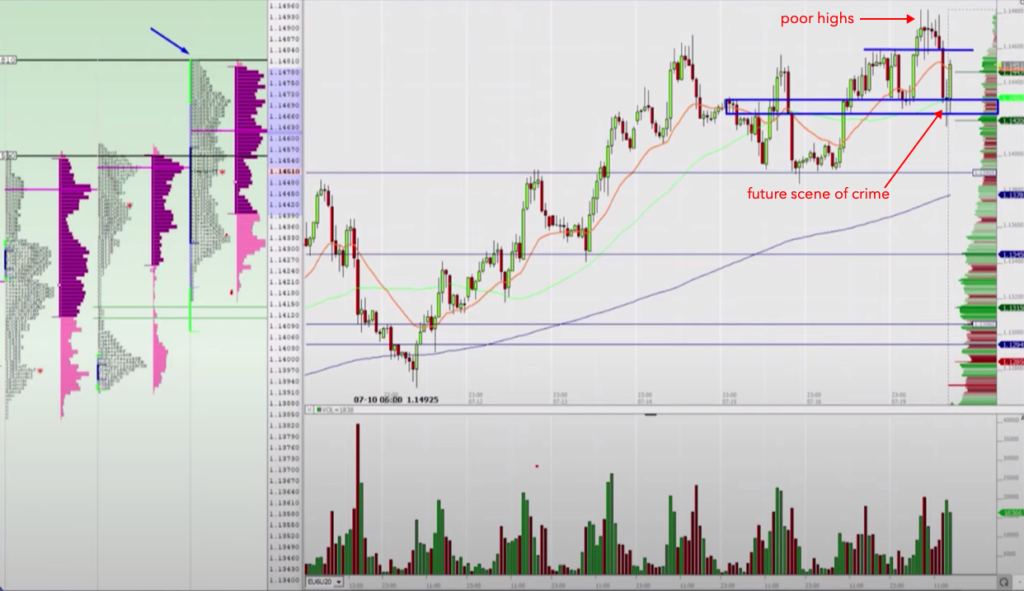
If you have read some of my previous articles where I always discuss market clues, in this particular trade Euro has provided something Peter Reznicek likes to call “WWSHD” aka When What Should Happen Doesn’t. What do I mean by that? As you can see from the image above, Euro has been positioned towards the continuation type of a move to the upside. After the break of daily highs at the 1450’s, the move created a poor high structure and compression zone between the 1480’s – 1450’s. Based on the structure of a poor highs and market holding above 50’s, the idea for the continuation type of a move was clearly on the table. The more time market spent in the compression zone, the more longs built their positions. Then came into play the WWSHD clue. When many longs intraday are positioned towards a certain direction, if that move does not materialize, then there is a higher likelihood for liquidation type of a move like the one that happened in the Euro.
Long Liquidation Resolution
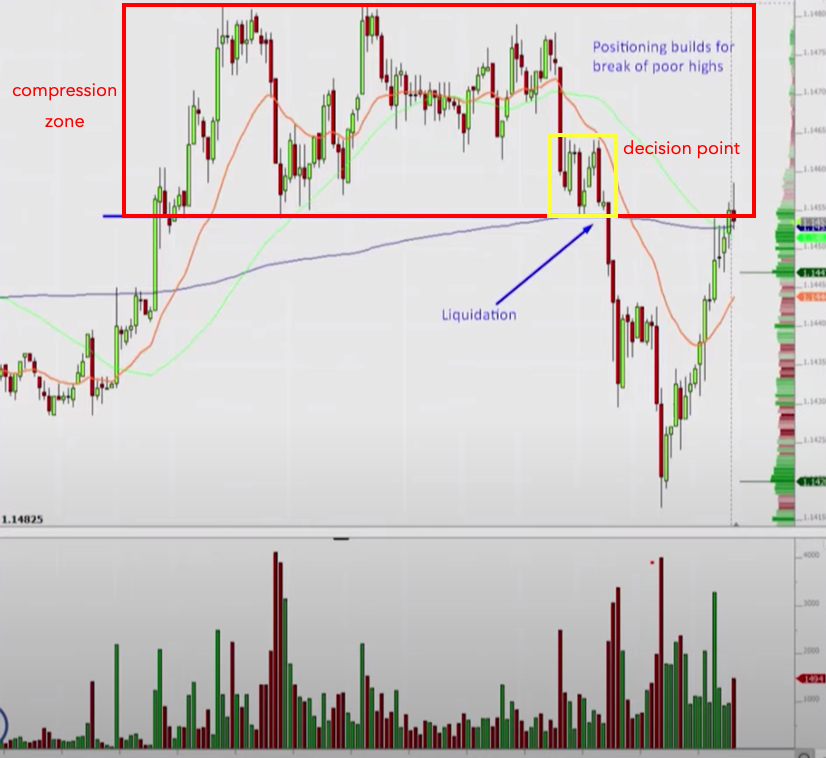
Now we have a context set and its time to look at the execution. As we see the market approaching the key level (bottom of yellow box), three bounces of the 50’s area are not producing any continuation move to the upside as the longs expecting. A decision point/zone is created and pressure is building around the 55 level. Now, if you are long, you are starting to get worried and understand, that any move below 50 you don’t want to be in a trade for the short term.
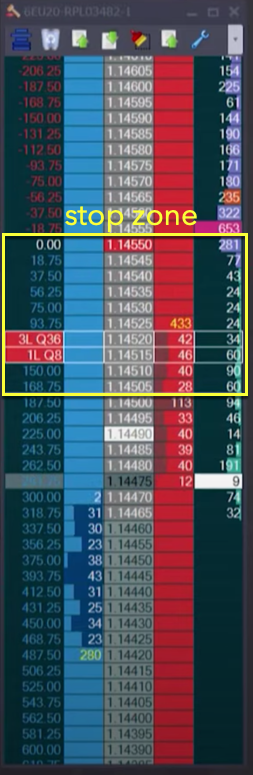
If you have watched the part of ladder (DOM) recording, it is clear that there is no interest in bidding up of the 55-50 zone. There is simply no willingness to buy as we are approaching the 50 level and once we broke below, we have our stop zone in place. If you have missed this break, you might be able to add in the short at the LVN and play for the liquidation type of move towards last swing low or ideally for the yesterday low which the Euro has eventually reached. As this is a liquidation type of a move, it might get tricky where to add into the trade if you have missed the entry through 55-50. You need to get more aggressive and either wait to enter at the LVN formed on the ladder or immediately hit the bid as we start trading below 50. Once you are below 50, you have clearly defined stop-zone from 49 – 55 as seen on the image above (yellow box). From that moment on, the market created this two-legged move down taking eventually the yesterday low and then reversing all the way back up, signaling that this was truly a liquidation type of a move.
Long Liquidation Summary
The key takeaway for the market liquidation type of moves is the concept of “WWSHD”. When one side becomes overly positioned towards a particular direction with more clues pointing in that direction, that eventually does not turn out to be true, we can expect the move in the opposite direction in a fast fashion. What adds even more to the intensity of the move is the amount of energy that has been compressed over time towards a particular direction (meaning the number of positions that has been built over time) that needs to be released when the expected move does not happen. Hence the “WWSHD” analogy is a nice concept to use in confluence with the liquidation type of a play.
In case you are interested in finding out more about trader training to learn how to trade and explore other great trading strategies, check out our futures trading course that teaches you exactly that and more. Or if you want to really maximise your ladder execution, check out our price ladder trading course.
If you liked this type of content, you might check these videos as well:
Thanks for reading and until next time, trade well.
JK