Key Takeaways From Candlestick Analysis Of Euro And Oil Introduction
In this article, we will discuss some of my key takeaways from the candlestick analysis of Euro, Oil, and other products recorded on Eric live-stream. I will focus mainly on big picture contextual clues, extensions, WWSHD, and relative comparison of the previous price action at the same location. I will highlight clues that I have missed, my thought process trading it live, and more.
This analysis is part of a private live streaming offering where we share Axia Futures insights with the Axia trading community. A smaller portion of the content is then shared publicly for free with the broader trading community via our YouTube channel, Instagram, and Blog. In total, the video down below is packed with technical analysis of 7 products so a lot to learn from.
Trading Opportunity In Euro
Most of the live-stream is focused on the Euro product. The technical analysis starts from here. Euro has been trading in a range for three days before breaking up higher. This break is what we will focus on. It has been in a continuous uptrend for the last two weeks so, from a daily perspective, buyers were in control. I like a couple of points Eric has highlighted. First, it is the comparison to the previous daily highs (which I have personally missed) and how it got rejected back in the past (see the blue box down below). The blue box highlights, that the rejection was much stronger to the downside in the past. But not this time. This time we have come and created a rather compressed daily range without much of a rejection. Yes, last time we were trending down and sellers were in control but the relative comparison gives you one clue that this time, sellers are not so eager to sell and energy is building up in the multiday range.
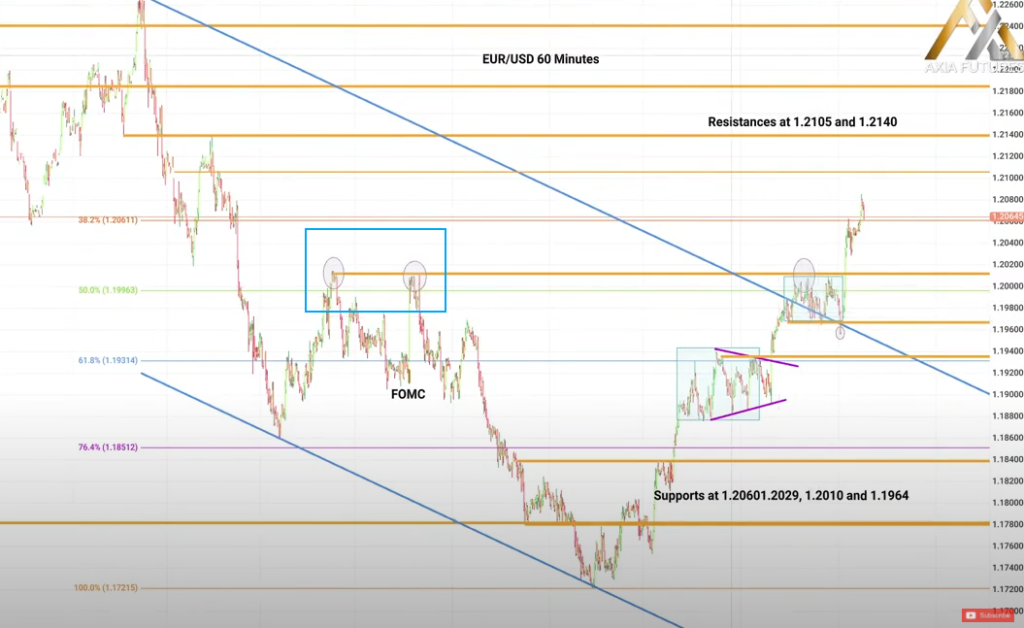
Before commenting on the break, I want to give you my thought process because I was trading this break. Notice, that before we broke the range higher, we actually took the low of yesterday (in the Asian session). We took the low and started to move higher. First back into the range. And then very consistently started to move higher without any decent pullback (a sign of potential short-covering squeeze). My thinking at that time was, we will take the daily range highs. But my logic was telling me that if we will take the highs aggressively but momentum fades away quickly after, this move is going to fade back into the range because of the exhaustion. I was wrong. You see my idea was the opposite of Eric. My thought process was that buyers will be exhausted, stops will be taken once we break the highs of the daily range and we will pull back. Nope. I managed to make very little money on the fade but only because I quickly recognized the energy with which we broke had a continuation characteristic, not a reversal. Now back to the clue Eric has pointed out.
The second clue that I like that was highlighted by Eric is the resilience candle prior to the break. From the price ladder you can recognize that every time we break to the new high, we start to hold. That last red candle prior to the aggressive break is the last resilience candle that could not fill the low volume area just left behind. There was also a larger size sitting on the offer that once taken, might trigger the even bigger move. Placing your stop below the resilience candle and going for a break was a place to be.
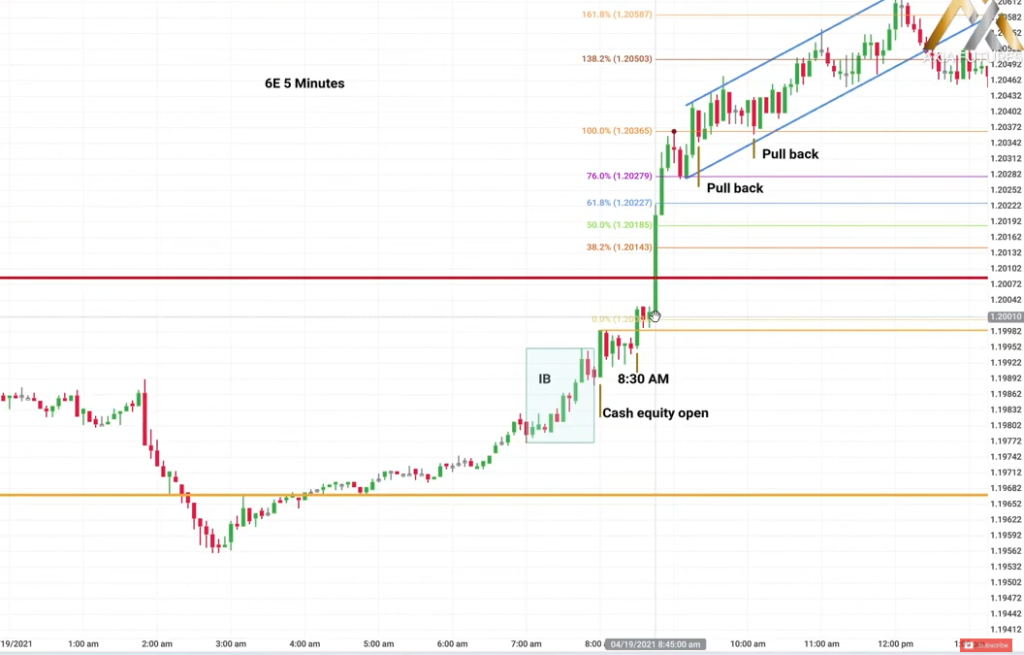
If you want to watch the price ladder break to the upside, it starts here.
Trading Opportunity In Oil
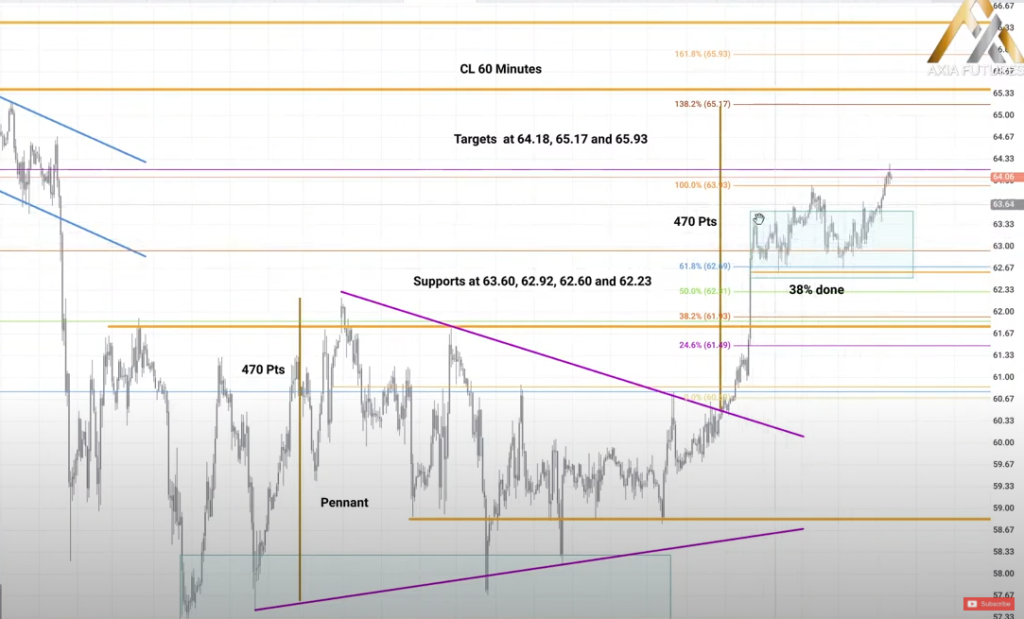
The theme of this observation is “keep the big picture” in mind and remember the WWSHD (When What Should Happen Doesn’t). What do I mean by the big picture? Down below you are looking at oil and its multi-week range. As you can see at the end of the range, the volatility compressed and we broke to the upside. The break was supported by Inventory numbers and produced an impulsive move higher leaving single prints behind. Given the energy compressed in the multi-week range, we should see Oil to continue trade at higher prices reaching the projected target. But that did not happen. Now you have a big picture in mind (energy should drive Oil higher), but Oil gets stuck in the tight range and cant rally anymore. Now WWSHD comes into the play. Oil should be at higher prices, but it’s not. Its lack of energy leads in the upcoming days to full retrace back to the original breakout point from the multiweek range. Two trading clues to consider in your trading arsenal could give you an opportunity to go short after Oil fails to break and continue higher.
If you want to listen to full analysis, it starts from here.
Technical Analysis Summary
Hopefully, the highlights have been helpful. To wrap up, keep in mind the big picture context, expectation vs reality projection targets aka WWSHD, and relative comparisons. If you would like to see other analysis from Eric from this particular stream, here is the breakdown of the timing:
- Euro, Multiday range breakout
- Pound, Double bottom neckline break + Channel break
- Dax, Pullback
- Stoxx, Pullback
- Bund, Downside channel
- ES, Upside channel
- Gold, Double bottom neckline break
If you liked this type of content, you might check these videos as well:
- Support & Resistance Explained – Candlestick Charts | Axia Futures
- 3 Trading Principles – Candlestick Charts | Axia Futures
- AXIA Junior Trader Looking For Break Of Trendline In Gold | Axia Futures
If you like our content and would like to improve your game, definitely check one of our courses that teach you all the techniques presented by AXIA traders from a market profile, footprint, or order-flow. If you are someone who likes to trade the news, we have a great central bank course. And if you are really serious about your future trading career, consider taking AXIA’s 6-Week Intensive High-Performance Trading Course.
Thanks for reading and until next time, trade well.