When Market Correlations Get Back In Sync Again Introduction
Let’s have a look at the topic of correlations, specifically, when market correlations get back in sync again. Correlation is a market dynamics when two or more markets move either together (positive correlation) or in the opposite direction (negative/inverse correlation). The obvious time when these forces are in play happens when market trades in its true risk-on/risk-off mode. In the risk-on environments equities rally, fixed income, and dollar offers, and vice versa for risk-off env. This has to do with money rotating between riskier assets and safer assets. If you have been paying attention to correlations more closely, you must have noticed that these dynamics do not always work but there are times when they get back in sync that might provide a favorable trading opportunity. And this is what we are going to focus on in this article. Other times we can rely on the correlated markets to manage our position like in the trade described here.
This article is based on the video down below.
Setting The Base For Dax And Bund Trade Idea
Starting with the big picture, we are looking at DAX (on the left) and BUND (on the right). DAX has led with weakness into the day before our execution. BUND started with weakness (test down and reverse part) but reversed and closed higher. Chances for the rally and continuation higher favor Bund thanks to the base and V reversal characteristic.

At the moment we can say, that both products are positively correlated. We will monitor the pair (DAX[equities] vs BUND[fixed income) and try to lean on the “catching up” if it occurs. Let’s move on to the lower timeframe.
Zooming In On Lower Timeframe
On the open DAX creates a large initial balance (a possible sign of a rangebound market after the cash open) and Bund creates a very tight initial balance (that can signal a potential directional breakout). So far we can witness a positive correlation with a partial retrace of DAX after the cash opens back into the middle of the balance and reversing higher. Bund in a meantime breaks strongly the tight initial balance and creates an impulsive move higher.
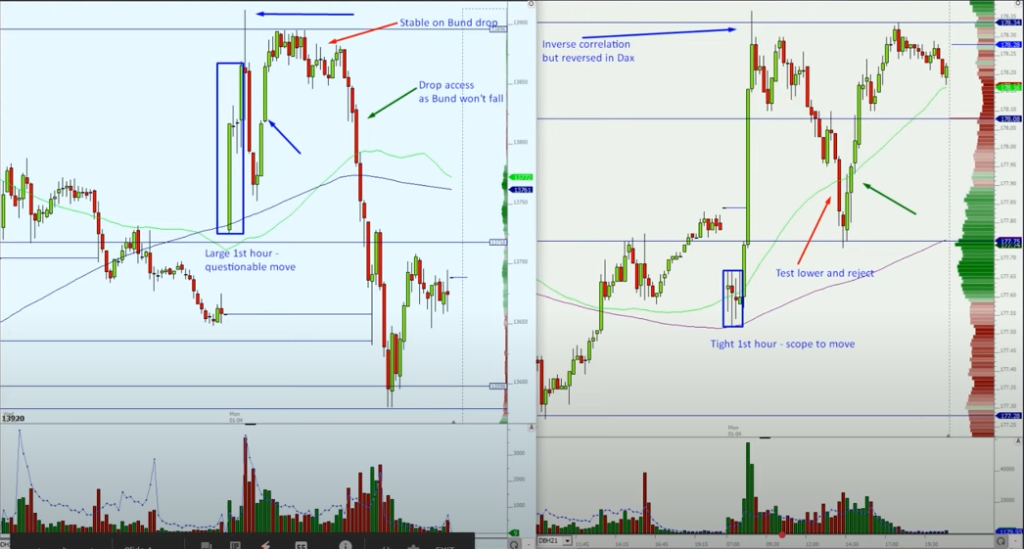
As DAX is creating a compressed range at the top of the chart, Bund starts to roll-over down. As the Bund starts to hold the ground after its fall, DAX starts to fall back into its initial balance leaving for us an interesting target of the unclosed gap. Let’s zoom in on the access point and possible execution.
Access Point In The DAX
As the DAX starts to roll from its upper range, Bund starts to reverse at the previous day high. With the vulnerability left in the DAX in the form of the unclosed gap, we can start targeting this gap as we break short and lean on the correlation while maintaining our position.
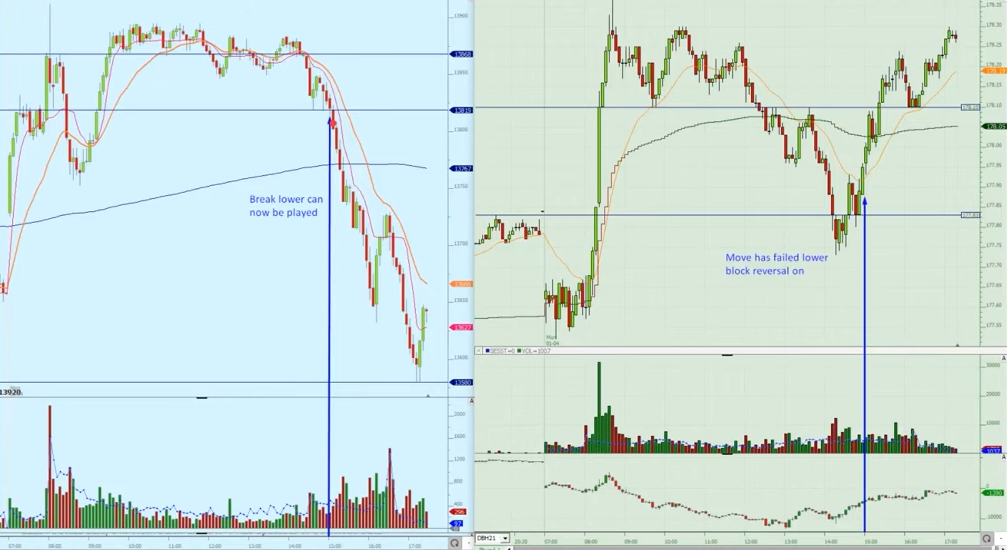
The key takeaway from this trade is not the idea to purely search for correlations to catch up (because many times they don’t), but rather monitor variables we can lean on. Variables that can give us extra confidence keeping the trade on. In this particular instance, it was a series of clues + the correlation catchup that made this trade possible.
If you liked this type of content, you might check these videos as well:
- Price Ladder Correlation Play Between Dax & Eurostoxx | Axia Futures
- How Correlation Can Influence Your Trading Strategy | Axia Futures
- Correlation Breakdown – Price Ladder Trading | Axia Futures
If you like our content and would like to improve your game, definitely check one of our courses that teach you all the techniques presented by AXIA traders from a market profile, footprint, or order-flow. If you are someone who likes to trade the news, we have a great central bank course. And if you are really serious about your future trading career, consider taking AXIA’s 6-Week Intensive High-Performance Trading Course.
Thanks for reading and until next time, trade well.
JK