Stalking Trading Clues Leading To Inside Day Break Introduction
In this article, we will focus our attention on stalking trading clues leading to an inside day break. We will not only look at potential scenarios for access and management of this trade, but we will break down each clue and explain the importance of our trade assessment. Markets are constantly trying to tell us a story. Story of what market participants are doing, trying to do, and how good of a job they are doing. An important skill each trader needs to develop is the ability to keep track of these ever-evolving stories by building a rolling narrative. Let’s break down a rolling narrative for a trade that happened in Bund.
This article is based on a video down below.
Building Big Picture View
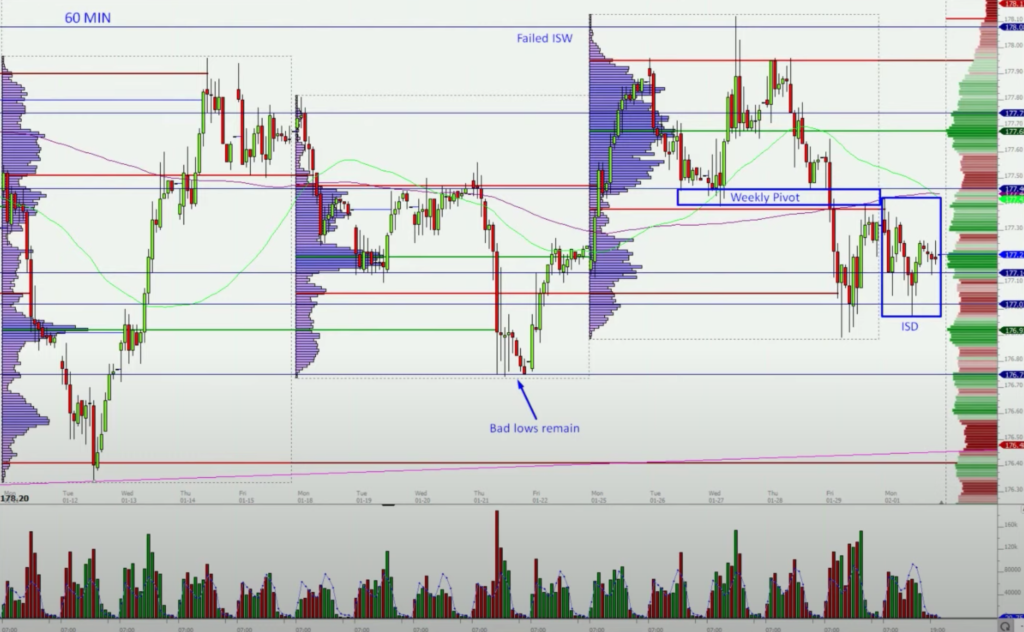
Before zooming in on a part of the execution, we would like to build a narrative that will lead to our trade execution. Starting from the market profile weekly view (60min chart) we can start noticing clues that will lead to the activation of our trade. Given the chart, we understand we are positioned mid(lower)-range over the last two weeks. We have just recently broken lower (on the initiative move) and created an inside day (ISD). Working backward, we know that we have also come from the upper range of the multiweek balance where we failed to break higher and provided inside week failure (ISW). Going even more back in time while we were analyzing a chart, we have noticed that bad lows were created in the prior week. Not only that, those lows were created on an ECB day. This creates a high degree of vulnerability for the market to repair at some point. As we are coming closer to the mid-range and breaking to the lower part of the multi-week range, our trade is slowly getting activated.
Let’s recap the clues that we have so far:
- Multiweek range
- Bad lows
- Bad lows created on the day of ECB
- Failed Inside Week to the upside
- Initiative (volume + volatility expansion) break to the downside
- Tight range below the Weekly Pivot
- Inside day
Zooming In On Trading Execution
Market Profile Analysis
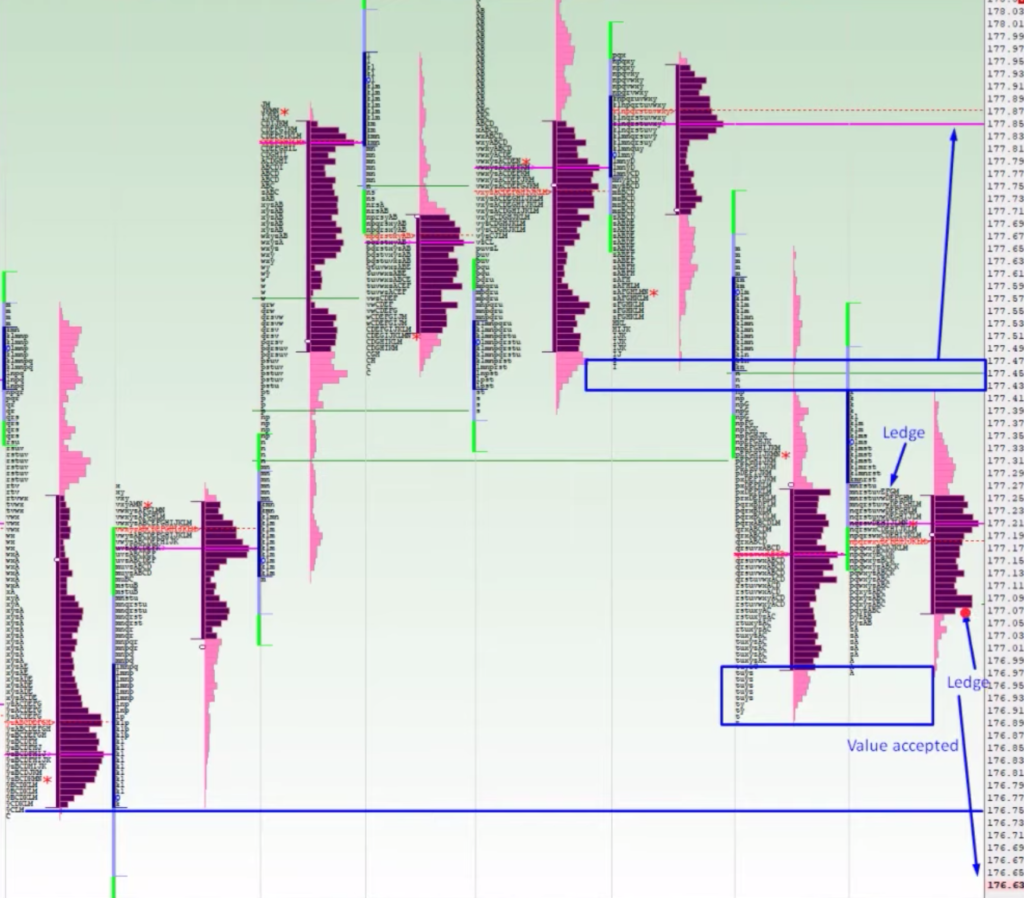
Given the big picture clues, we can now zoom in on the market profile and identify the potential zone for our execution. We can see that after an initiative break down, the value clearly shifted and was accepted the next day. This not only created an inside day but also a well-defined ledge from both ends. Although we can clearly play both ends of the inside day break, we are focusing on the vulnerability that formed during the ECB day near the lows. Keeping our narrative rolling, we are adding three more clues:
- value shift that happened after the initiative break
- value acceptance after the initiative break
- ledges that have been formed from both ends
Trade Execution And Scenarios Building
Now it is a show-up time. We have a narrative we know we would like to play. We need to define
- access point criteria
- scenario for our trade
In terms of access point criteria, we know that the break of the ledge might be our activation point. Once the ledge is being broken, we might distribute our first clip size there. As we start breaking lower through inside day low, we might distribute the remaining clip. This all depends on personal preference and style. The most important thing is to understand at what point your trade gets activated. It is usually by the combination of a triggering price and certain price action a trader wants to see. Once access point criteria are activated, we know we will execute according to the planned scenario. In our case, we know that this does not have to be necessarily a straight line A to B move. Given our understanding of the product and previous price action at the zone we will be slicing through, we can expect a moderately washy type of price action. This gives us one distinct advantage and that is not to panic when we will not see the cleanest of the moves.
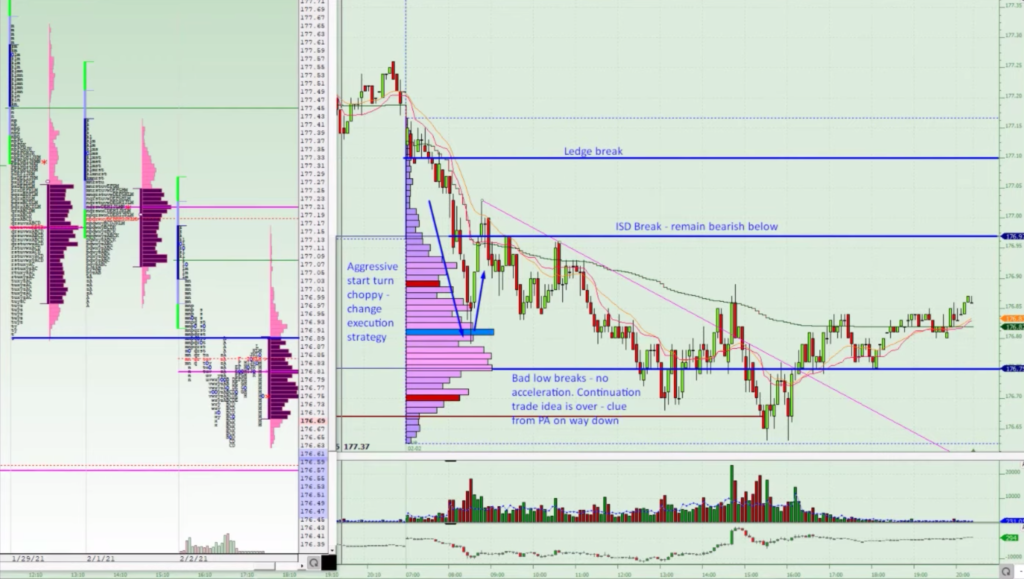
Eventually, this trade has proven to work for us but the trajectory from A to B wasn’t a smooth straight-line ride. It has reached its target of bad lows and started to stall there. Great location for us to take our profits.
An important takeaway from this article is to remember: keep building your narrative, have your activation zone ready, your invalidation price in mind, and set the right expectations for your trade because 9/10 times, it is not a straight-line move.
If you liked this article, you might check these videos as well:
- Trading S&P Long Liquidation Strategy
- The Short Squeeze & Long Liquidation Explained
- Liquidation vs Trend Day
If you like our content and would like to improve your game, definitely check one of our courses that teach you all the techniques presented by AXIA traders from a market profile, footprint, or order-flow. If you are someone who likes to trade the news, we have a great central bank course. And if you are really serious about your future trading career, consider taking AXIA’s 6-Week Intensive High-Performance Trading Course.
Thanks for reading and until next time, trade well.
JK