US Presidential Election 2020 Trading Debrief Introduction
In this US Presidential Election 2020 Trading Review I will focus on certain clues that caught my interest in our debrief that Richard has done recently. This post will complement and extend our US Election post we have published on our blog as well. What I will be focusing on in this post is the following:
- disintegration between scenario and reality
- betting edge
- order-flow activity
To get a full grasp of the three main clues mentioned above, don’t forget to watch our US Presidential Election review.
Main Trading Clues
As I have described in the beginning, three clues particularly caught my attention in this debrief. Although they can be treated separately, together they create a change in narrative and support a concept of the “change on the fly“. Something that we as traders must become good at, because it is our job to continuously adapt, that is and must be part of our DNA.
Disintegration Between Scenarios And Reality
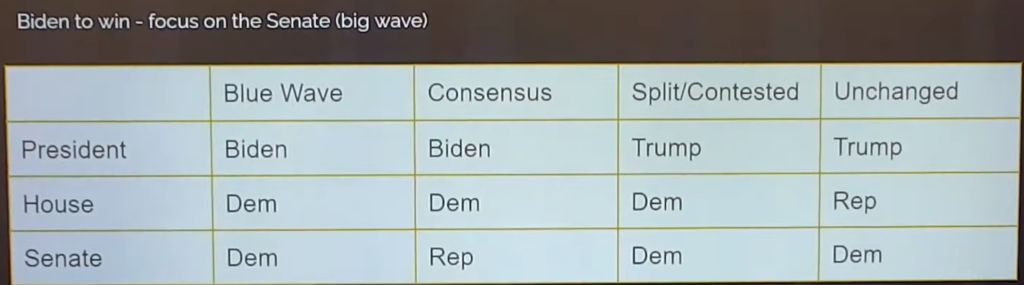
Something that we preach at Axia Futures quite religiously is the ability to prepare properly for any news event. That means building scenarios for the possible outcomes. In this case, based on the table below, two main scenarios were:
- risk on (blue wave or consensus) on the back of more stimulus
- risk-off (split/contested or unchanged) on the back of continuous uncertainty
As the election night was progressing, it was becoming more and more obvious that the expectation and scenarios designed started to be disintegrated with reality, correlations started to break down. At this point in time, when things, specifically the market do not react as you initially intended, it is not the time to give up and say, “my scenarios did not work, I am not trading”. It is a time to ask yourself what are the other clues you can lean on and start paying attention to them. That gets us to our next clue.
Betting Edge
Throughout the night one of the indicators you could have used was the view of betting world percentages by half an hour blocks. An important thing to realize is the absolute deviance the odds can have over a short period of time when at one point one candidate can have a 70% chance to win and in another moment he can have a 30% chance. In the trading world, that can seem like a dramatic swing of the market, but in the betting world, this can be pretty normal. Now let’s have a look at an interesting inflection point that happens right around 2 AM GMT (10 PM ET).
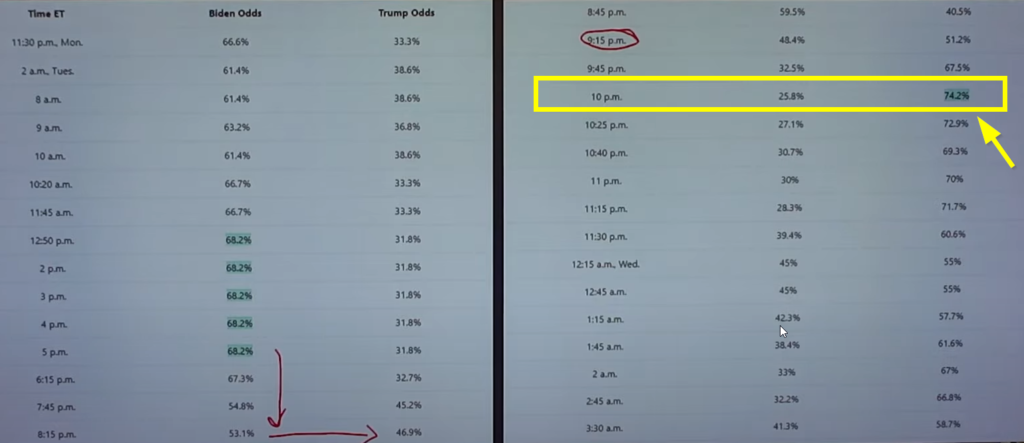
As you can see, the Biden odds were roughly the same until 6:15 PM time, but then started to turn and at 10 PM, Biden chance to win changed to 25.8% and Trump odds were suddenly at 74.2%. At this time you have collected in real-time a new clue. Even though your scenarios are not working, this is new information. Now it is the time to observe the market and lean on the price action and price ladder dynamic that can tell you which way at this decision point markets are heading.
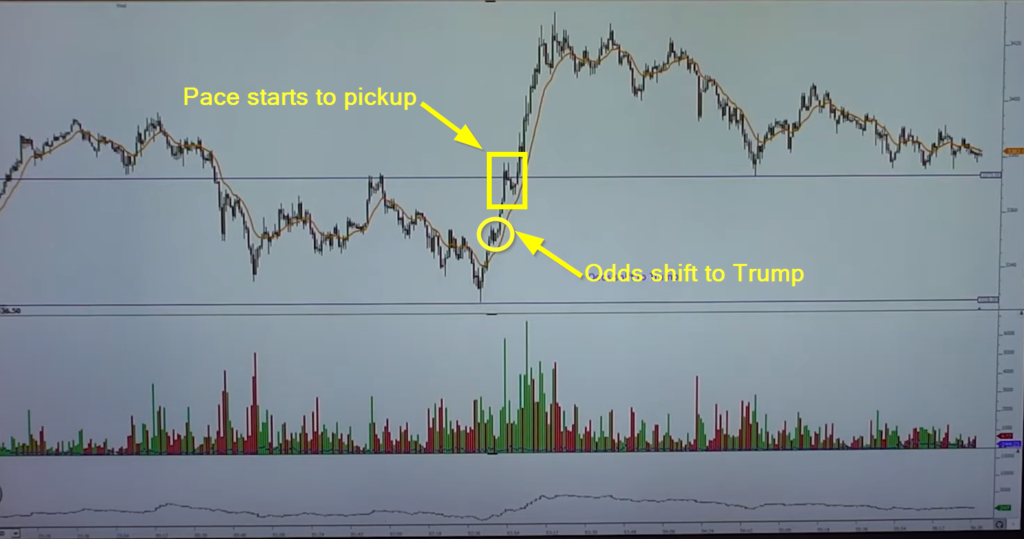
Order-flow Activity
Given the clue that has been handed to us from the betting world, we are switching our focus towards the price ladder order-flow and chart price points. We know so far, that the sellers were dominant but we have just been unable to break through lower. We know that our line in the sand is above 55 which is a midpoint of the trading range we have been in. As odds in favor of Trump are shifting, we start to observe an increase in pace on a price ladder. Now it is all about turning around of positioning of the market. As the pace picks up, you must adjust on the fly your stop size. As we clear through 55, 75 is now a level of decision. If we are able to create a continuation move, we will take the high of the range. As we break 75, we should not get discouraged by a retracement, potentially being stopped out here. A little flag is created and we should be now constantly thinking about how we can get back. Or, if we continue to move lower back below when the odds shifted, how we can get back on the short trade. As the flag is breaking to the upside, the pace is picking up again. This is our chance to jump in and use the opportunity to trade the market to the upside.
Summary
Between other lessons such as that we won’t know the winner on the election night, markets not being as binary as in previous elections and Trump win not being necessarily a risk-off play, the key lessons are:
- not being stuck with the scenarios that did not work and adapt on the fly
- take clues from the betting world and overlay them with price actions pace change
- use previous clues and order-flow activity as a guide towards the change of positioning
Wanna learn how to trade the news events such as this one? Check out our central bank trading course. In case you are interested in finding out more about trader training to learn how to trade and explore other great trading strategies, check out our futures trading course that teaches you exactly that and more. Or if you want to really maximize your ladder execution, check out our price ladder trading course.
Thanks for reading and until next time, trade well.
JK