Trading Long Liquidation Break In US Equities Introduction
In this post, we will be looking at trading the long liquidation break in US Equities (S&P500 aka Spoo). This trade has been done by Senior Axia trader but unlike in our previous post (Trading German Bund On The Stimulus News), this time it was purely a technical trade. The trader was not hitting the news but was playing for the weakness of longs that triggered the long liquidation move in Spoo. One of the key characteristics of this move was his ability to read the price ladder order flow that triggered his conviction to go short 60lots.
This post is based on the second part of the video down below starting at 22:08.
Breaking Down The US Equities Trade
Contextual Summary Of The US Equities Trade
First lets start with the daily view of the market.
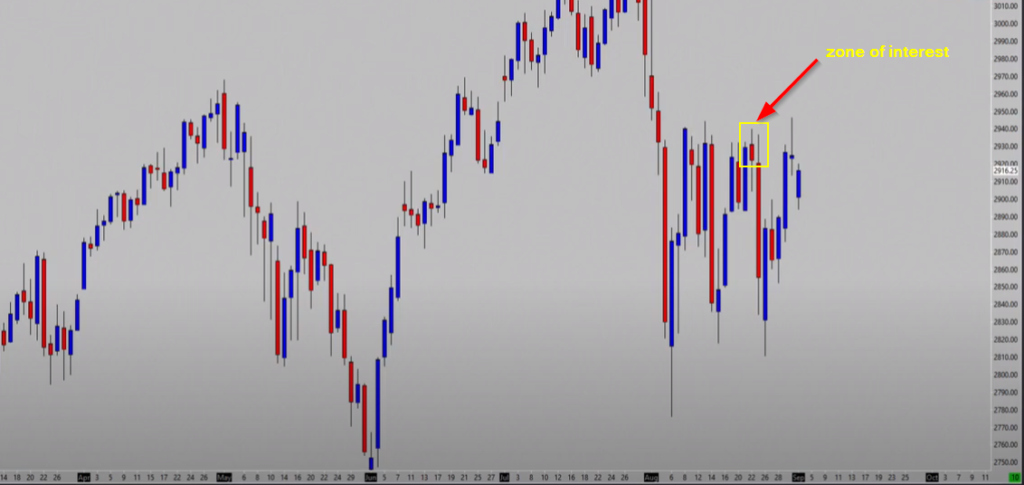
The idea of the short is happening at the extreme of the range where the daily direction is still short after multiple days of bigger sell-off. After the sell-off from the highs, we have consolidated and put in place a multi-week balance zone. Our zone of interest has been highlighted on a chart. Why at the edge of a balance? Because there is a higher degree of probability that decisive moves will be initiated there. Either responsive sellers will hold and defend or initiative buyers will be able to break and hold. Now let’s have a look at the market profile to understand in better detail the auctioning process.
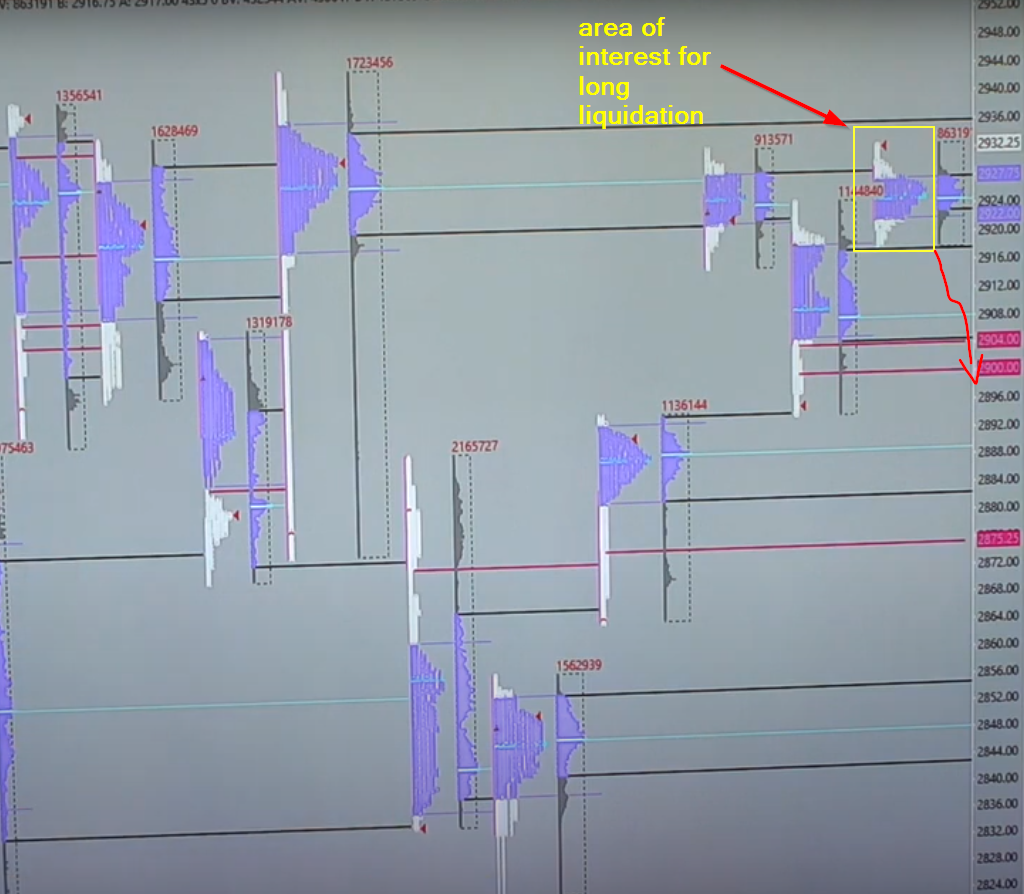
Since we have now an understanding of the daily location and daily trend that is in place, we can start looking at the auctioning process. On the day before our trade, we can see we put in place a balanced day but closed near the highs. This is the first clue, that a certain imbalance is being created. Going into the next day, we want to monitor our trade idea for potential reversal and understand, if buyers will have enough energy to lift the offer and continue further up from this imbalance. If they won’t, they will be in a difficult position and they will have to start covering their long positions. Hence the “long liquidation” name. Now let’s have a look at how the next day unfolded before we have entered our trade.
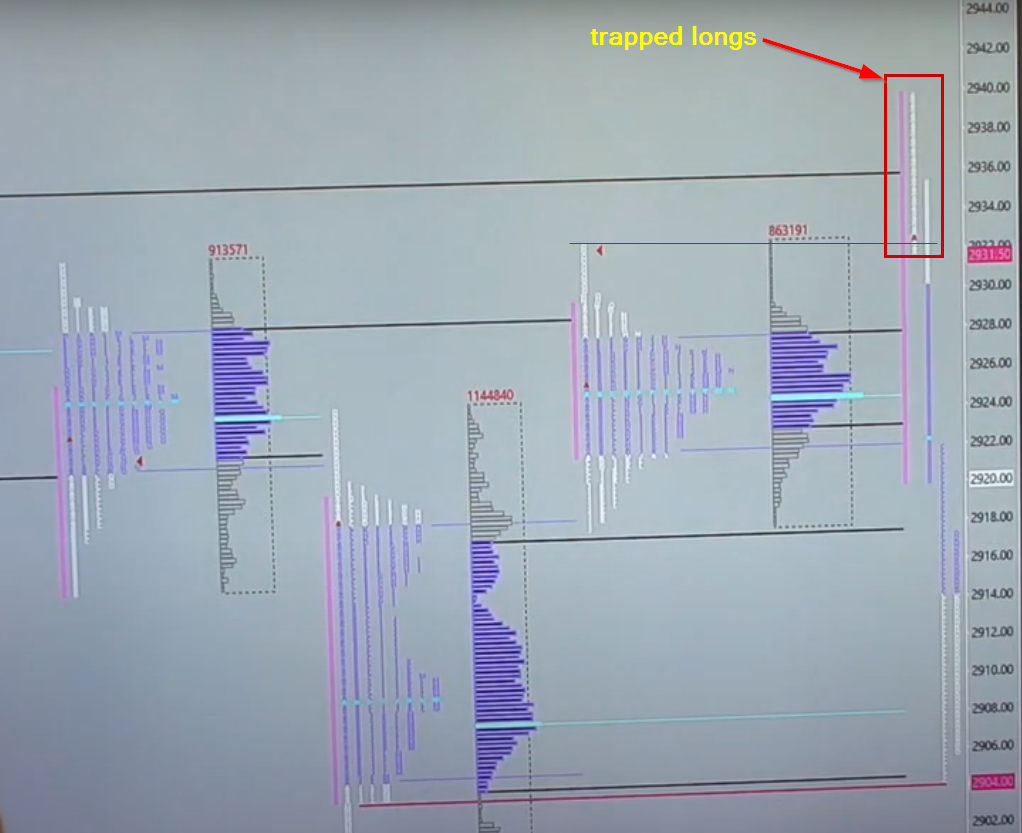
What you see above is a market profile of a cash session for Spoo. After a muted hawkish FOMC Minutes reaction we traded in a small range overnight. That low of the overnight range was not tested by the European session. Given the US Cash open and a way how we have rotated out of the previous day range and back (failed momentum to the upside), given the hawkish FOMC minutes, fresh untested low of the overnight range, we were potentially set for a long liquidation move. The last thing that was missing was a price ladder order flow confirmation. Let’s put the last missing piece together.
Price Ladder Execution Of The US Equities Trade
Its order flow time! See the start of the recording with price ladders to fully grasp what will be described below. In this particular case, the trader wanted to see a very specific order flow. The personality of the particular order-flow he was looking for can be described as “sticky offer, taken bids”. This simple description is the last missing piece for this trader. You want to see the sticky offer (when the offer comes and holds, the rotations are shallow or none), the offer is thickening a bit, bids are consistently taken without huge effort. This is what we want to see.
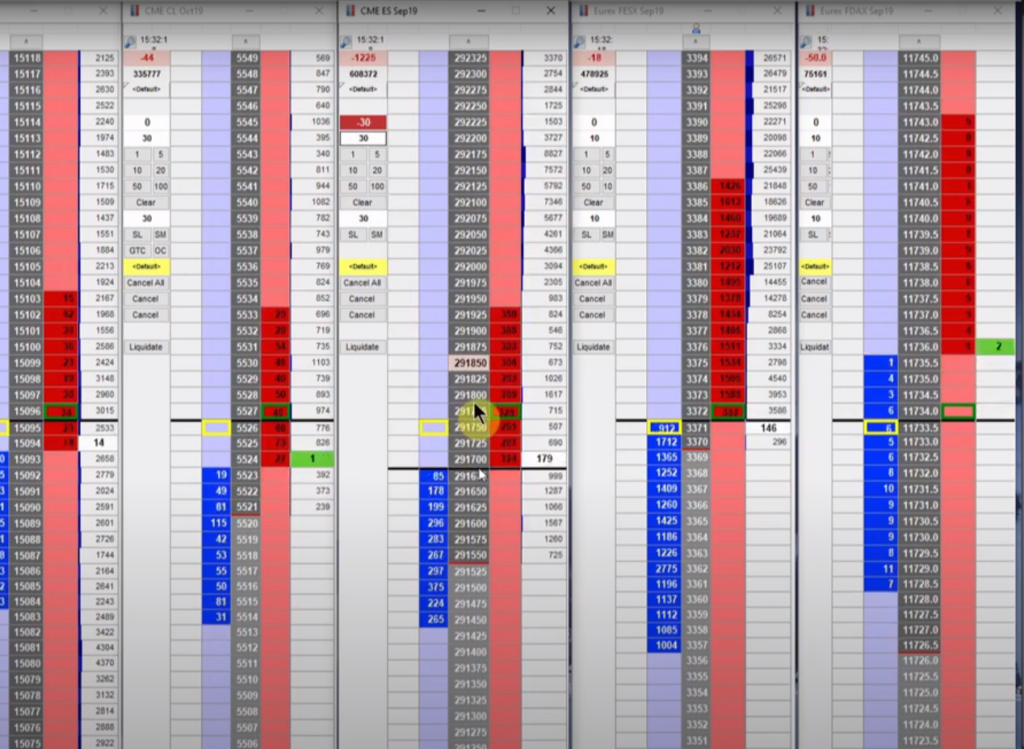
So what was the execution of this trader? The moment he recognized the anticipated price ladder order flow, he clips 30lots, as the market moves forward, he clips another 30lots. As bids are being taken, he is hoping for that acceleration move. The moment rotation gets deeper than he expected, he gets out with 30lots, holding the remaining. As we are moving down, as long as the rotations are shallow, he holds. When the rotation gets deeper again he scales out. With this technique, he slowly scales out of his full-size position and banks a nice profit. Although he has not been able to get the full move, his execution-style gave him the edge to get the most out of the move.
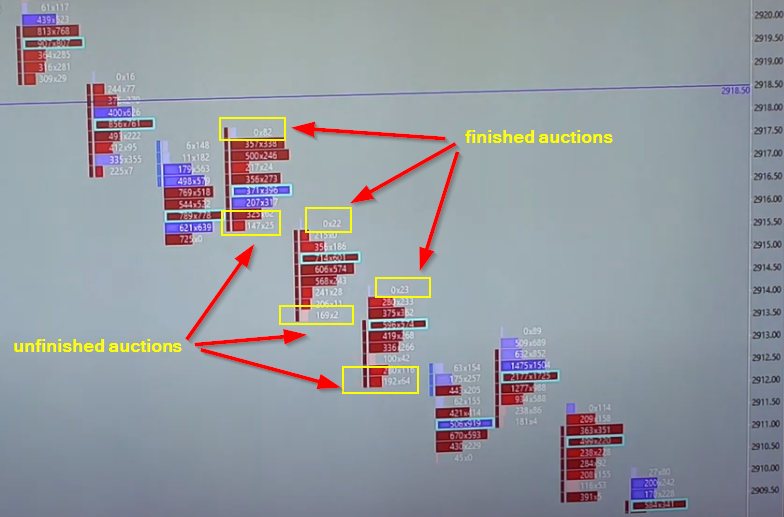
To wrap up this trade, there was one more tool you could have leveraged as well: Footprint. Footprint could have given you an understanding of finished and unfinished auction and add a little bit of conviction to hold onto your trade. Finished auction at the high of each rotation, more conviction to hold onto your trade. Unfinished auction at the low, more conviction that the low will be retested. Overall the combination of market structure understanding, positioning and price ladder reading skills enable this trader bank profit from 60lots he has been able to clip in this market. With conviction and good execution.
If you liked this article, you might check these videos as well:
- Trading S&P Long Liquidation Strategy
- The Short Squeeze & Long Liquidation Explained
- Liquidation vs Trend Day
If you like our content and would like to improve your game, definitely check one of our courses that teach you all the techniques presented by AXIA traders from a market profile, footprint, or order-flow. If you are someone who likes to trade the news, we have a great central bank course. And if you are really serious about your future trading career, consider taking AXIA’s 6-Week Intensive High-Performance Trading Course.
Thanks for reading and until next time, trade well.
JK