Journaling Best Practices In Gold Trade Introduction
In this blog post, we will be looking at the journaling best practices in the Gold trade as an example. When we are choosing the best journaling style that fits our personality we should always optimize for getting the most out of our time spent with the journaling. We do not journal just for the sake of it. We don’t do it because others do it. We should always have a goal in mind why we journal. For many traders, the goal is to create a journal we can always come back to and study deeply our trades. Essentially our ultimate goal is the integration of the patterns we have seen in the past for fast recall in the future.
This blog post is about looking at the journaling style of our Junior trader Harry. He traded Gold and we have picked a selection of chart templates with annotations he has used. We will also comment on the Gold trade itself. So definitely a lot to take from this article. If you like similar types of articles, don’t forget to check “Trading Initial Balance Break Using Market Profile“
This article is based on the video down below.
Journaling Templates
Context Of The Trade
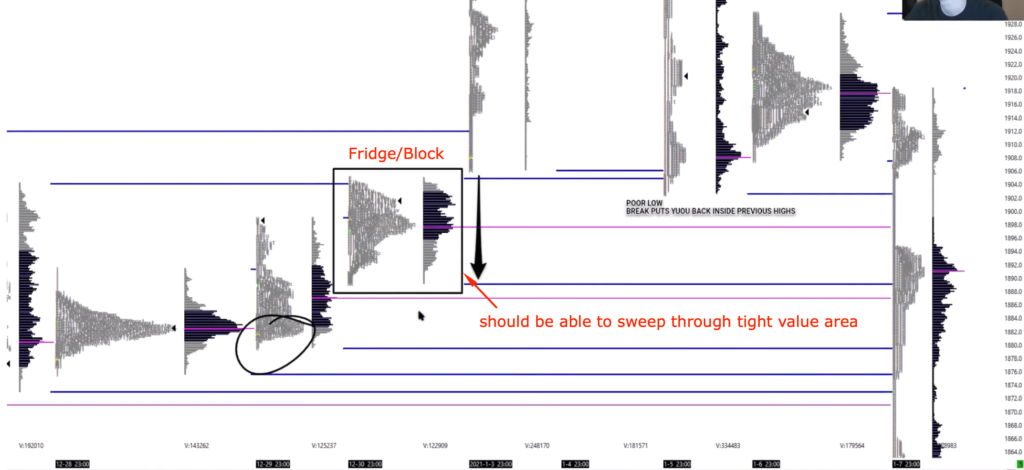
Starting at the high level, during the analysis phase Harry has identified a vulnerability in the market. Poor lows and bulky structure that can get swept once the market gets below a certain trigger price. Notice the annotations:
- Inside day
- Current Poor Daily Low
- No Tail On This Days Low
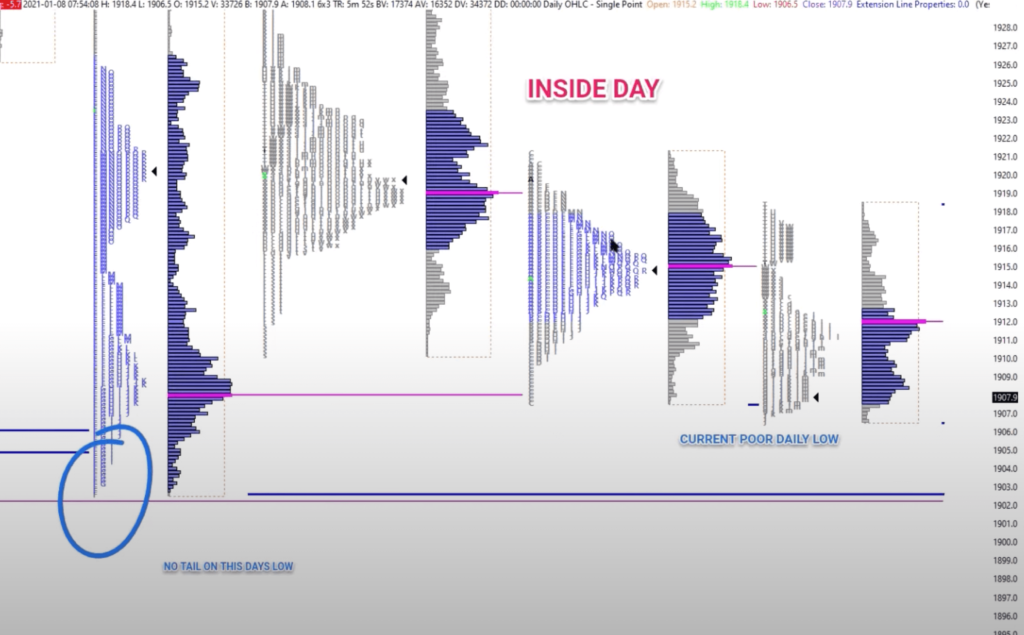
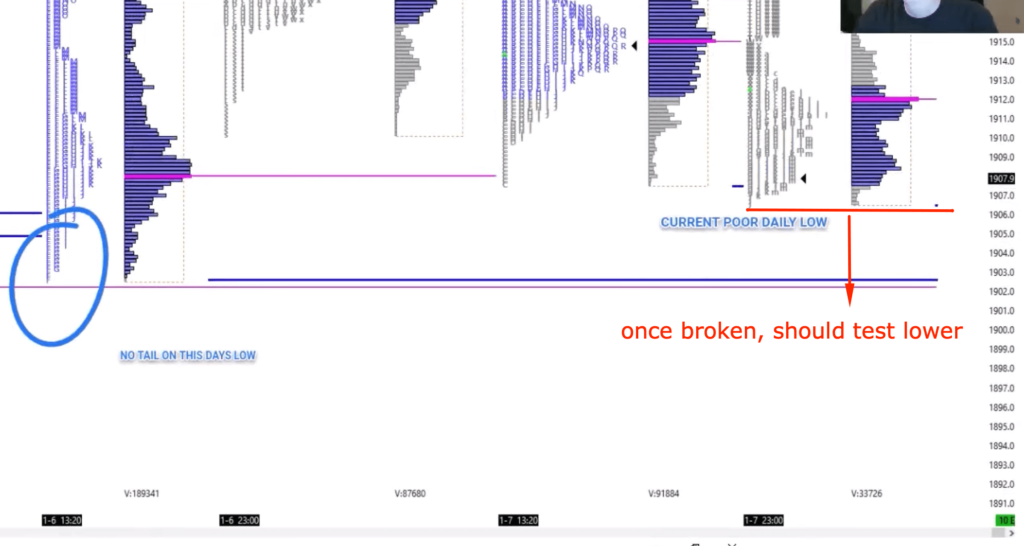
The red line is the trigger price we have mentioned.
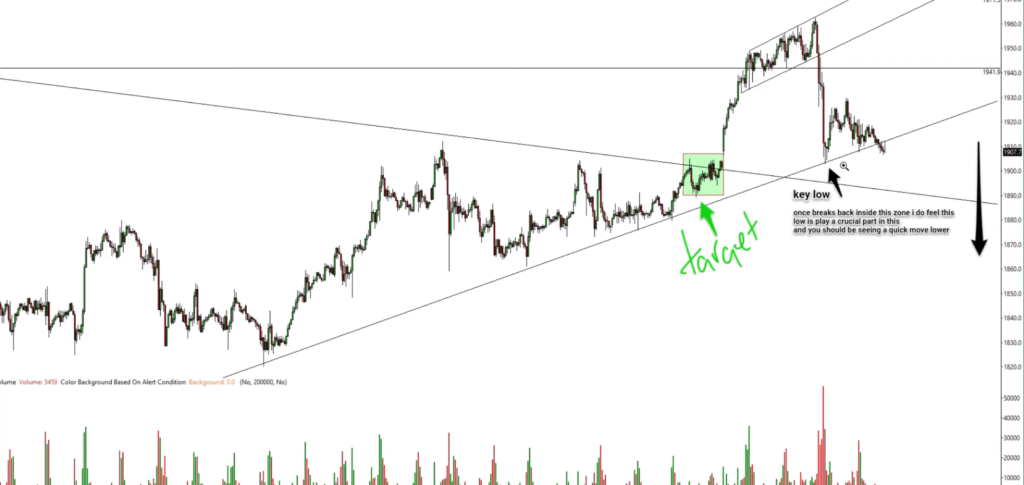
As we have highlighted the bigger picture in the annotation, we are adding one more layer to the context. This time an hourly chart and price action it provides. Again, notice the annotations:
- Target zone (green)
- Key Low
- once breaks back inside this zone I do feel this low will play a crucial part in this and you should be seeing a quick move lower
One piece of information that has been also highlighted is how the lows “felt” for Harry going into this breakout. He called them bulky. This usually signals that they will get tested and that creates a good opportunity for the sweeping action down.
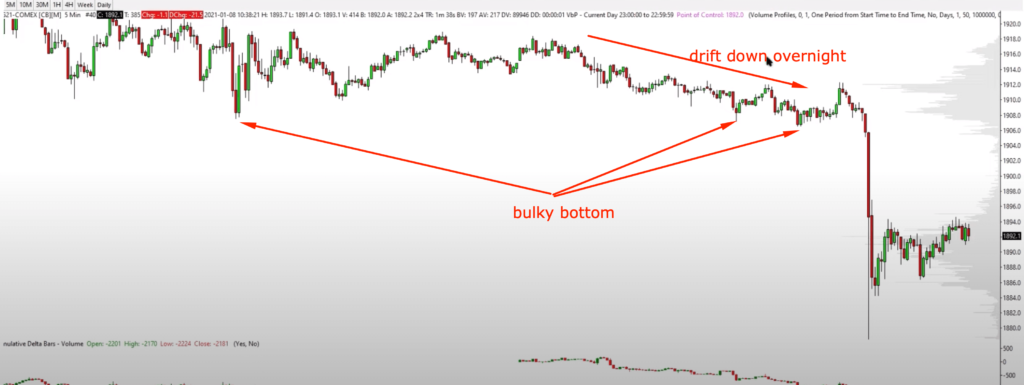
Now before we will move to the final execution charts, there is an important observation Harry has made. He was confident, that the blocky structure (he called this a tight value area that looks like a block or a “fridge” 🙂 will be swept. Again, he is using arrows in his annotations to signal what move he was expecting, highlighting again the poor low.
Trade Access And Execution
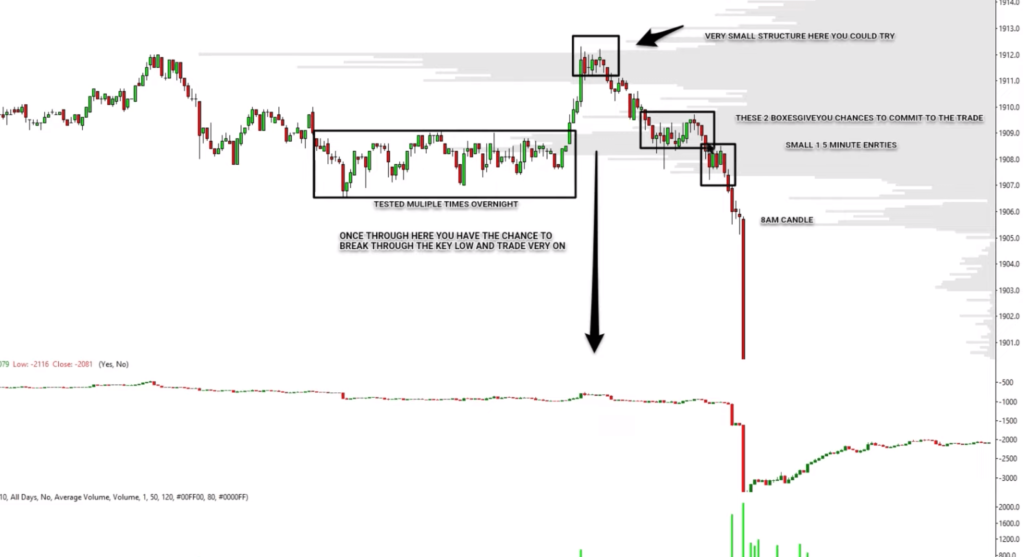
One thing Harry wanted to improve was his ability to access the trade early. For the future trades, he would like to focus on tight structures prior to the break, that can give him a good RR going into the break. He not only wants to get in on the break, but he wants to get early with a highly favorable RR. In his annotation, he has highlighted little 5 minutes blocks that stack below each other as possible access points for his future trades similar to this one. Again, observe what he has highlighted:
- A very small structure – here you could try
- These 2 boxes give you chances to commit to the trade
- Small 1-5 minute entries
- 8 AM candle (London Time)
- Box tested multiple times overnight – once through here you have a chance to break through the key low and the trade is ON!
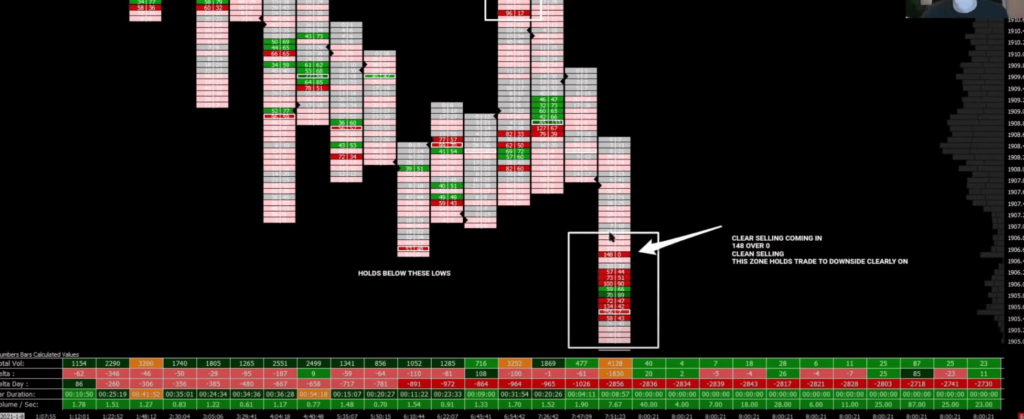
Finally, down below you can see a footprint chart. This chart is all about documenting were the big sellers stepped in and how they can help in future references for good RR opportunities. See the white box below. In that box large sellers, for example, 148 x 0 stepped in. This is a signal, that someone big is selling and the price should not rotate above this price much. Something to look for in the future breakouts and a good takeaway into a journal archive.
Trade Clues Summary
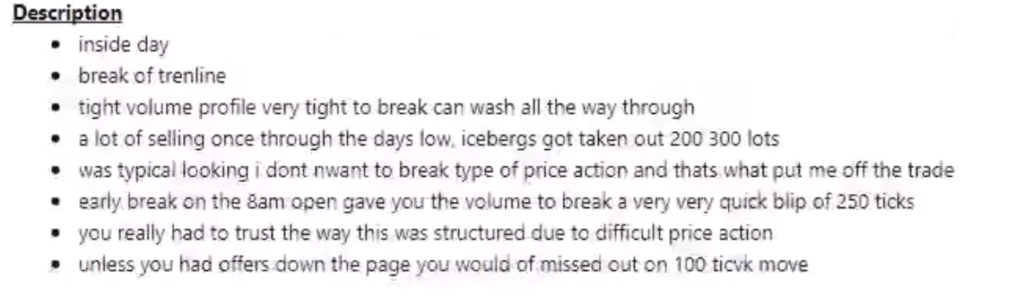
Last but not least. In order to internalize the clues that led to this rade, Harry has created this list that summarizes clues about the overall setup:
Key Trading Takeaway
It is important to remember, that everyone has a different journaling style, but the key takeaway is this: you journal, you annotate because you want to improve your ability to deeply understand the trades you are taking in the future to maximize your conviction, RR, and management of your future trades.
Thanks for reading.
If you liked this type of content, you might check these videos as well:
- How To Manage & Exit A Failed Breakout Trade
- Sign Of A Breakout About To Fail – Price Ladder Trading
- Market Profile Trading: Better Breakouts with Context and Volume Profiling
Do you like what you have been reading? If you would like to improve your game, definitely check one of our courses that teach you all the techniques presented by AXIA traders from a market profile, footprint, or order-flow. If you are someone who likes to trade the news, we have a great central bank course. And if you are really serious about your future trading career, consider taking AXIA’s 6-Week Intensive High-Performance Trading Course.
Thanks for reading again and until next time, trade well.
JK