Trading Initial Balance Break Using Market Profile Introduction
In this blog post, we will look at trading initial balance break using market profile. The key aspect of this trade was the market structure that preceded the trade. Specifically, the vulnerable structure this trader wanted to attack. Read below how Isaac used the European opening flows in the 10yr German Bund (FGBL) market to push towards the poor structure and how the trade did not fully turn out as he hoped. Also, learn from the clues he observed both before and after the trade was finished but the trade idea was still valid. If you enjoy similar types of posts about breakout strategies, don’t forget to read our previous post: “Trading Gold Breakout Using Market Profile And Price Ladder“.
This article is based on the video down below.
Market Profile Preceding Structure
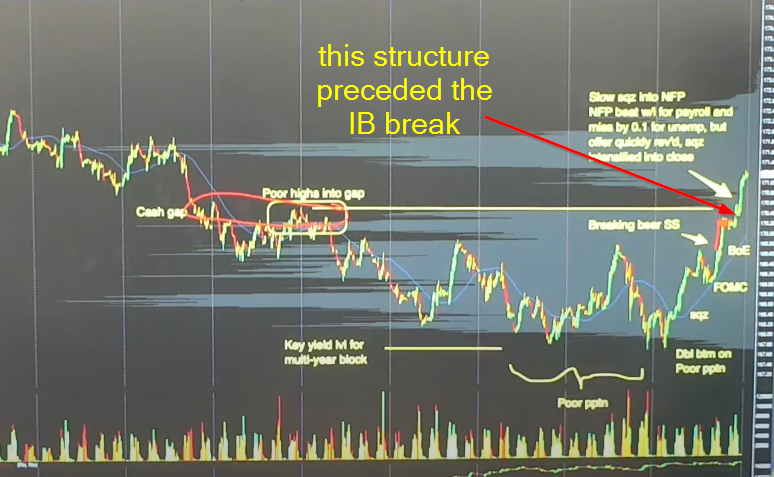
We will start with the preceding structure and will look at a couple of characteristics/clues that the trader has identified. On the charts below, you can see the structure including the price action after it broke the IB (see the red arrow). Let’s start with clues from the first image:
- poor highs into the gap – this highlights the weakness and unfinished auction that should be repaired at some point in time
- Yield level that supports the Bond price (near the lows) – certain Yield level prices represent a crucial psychological level. Therefore, it is important to understand not just the price of the Bond but also the Yield price as it can represent important turning points
- Multiple CB events (FOMC, BoE) driving the momentum higher near the vulnerable structure, supporting our breakout thesis.
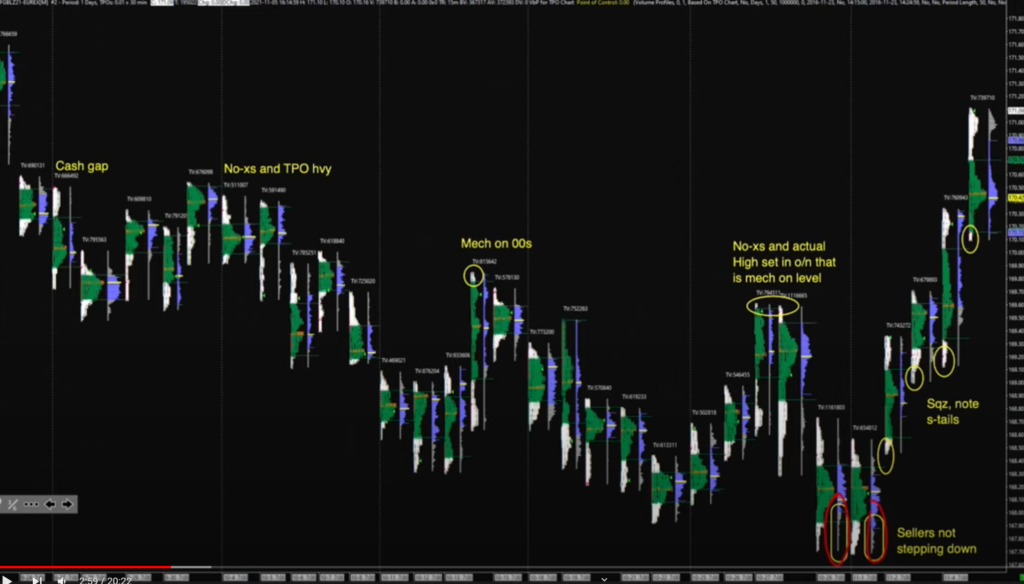
Given the clues above from the candlestick charts, we can now look at the market profile chart, expand and extract more clues for the insight of this type of view:
- Mechanical 00 – again, this has to do with lack of excess at the important psychological level 00. The subject of potential future repair.
- no-xs set in the o/n – a similar story with a lack of excess. In this particular case, the buyers simply dried up in the after hours (post-settlement)
- sellers not stepping down (near the lows) – this represents the selling tails (s-tails) that tell us the excess supports more longs because shorts are unwilling to step down and put on some decent size
Understanding the clues above, this is how Isaac summarized the opportunity:
Opportunity summary
- Market had strong bid: buying tails on profiles, value shifting higher, stretched profile shape, bullish after CBs (central banks)
- Poor highs above: no-excess into cash gap and TPO heavy
- Market strong close yesterday pulling volume value to highs and holding singles
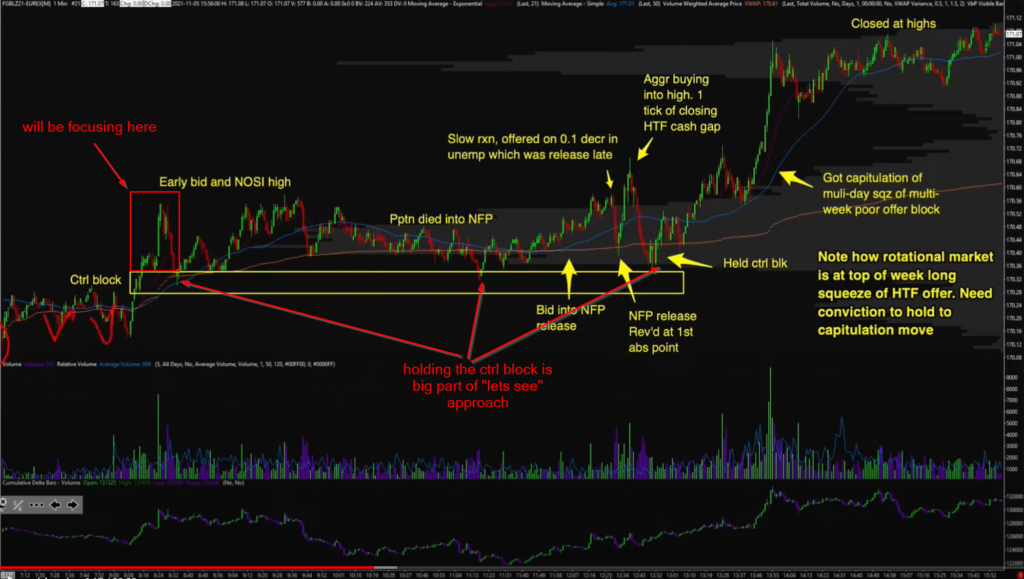
- IB within yesterdays upper block, respecting singles; offers within the IB are picked up
Trade idea
- Get long the IB (initial balance) break to see if the market can resolve the poor structure above
- The risk is that market doesn’t resolve the structure before NFP (which is what happened)
Initial Balance (IB) Break Execution
If you are interested in the actual price ladder execution, the live execution starts here.
If you have watched the recording of the Initial Balance break, you could have identified a couple of nunances in regard to trade management. Especially a little bit of room Isaac needed to give this trade post breakout. Unfortunately, market did not reach the original target near the vulnerable highs but provided an opportunity near the control block (yellow rectangle) multiple times a day. The most reasonable time to play this setup again was after the risk of NFP was on the table.
Here is the summary of key lessons:
Key Trading Takeaways by Isaac
- The key factor for success in this trade was taking the “see if” attitude as the move was not fast and so you needed to be willing to let it playout
- The key to decision making in the trade was constantly asking what you need to see and what invalidates the trade!
- And as long as your trade is not invalidated (stopped) then you keep holding
- Trade management was hard as there was the scenario where you are holding a position into NFP
If you liked this type of content, you might check these videos as well:
- How To Manage & Exit A Failed Breakout Trade
- Sign Of A Breakout About To Fail – Price Ladder Trading
- Market Profile Trading: Better Breakouts with Context and Volume Profiling
Do you like what you have been reading? If you would like to improve your game, definitely check one of our courses that teach you all the techniques presented by AXIA traders from a market profile, footprint, or order-flow. If you are someone who likes to trade the news, we have a great central bank course. And if you are really serious about your future trading career, consider taking AXIA’s 6-Week Intensive High-Performance Trading Course.
Thanks for reading again and until next time, trade well.
JK