Journaling Best Practices In Bund Trade Introduction
In this blog post, we will be looking at the journaling best practices in the Bund trade as an example. This is a continuation of the Journaling series, that we have started in our previous article: Journaling Best Practices In Gold Trade. The purpose of this article is to highlight the importance of making the right journaling notes about the trade or the trading opportunity, that will serve you best in the future. Journaling about the trade is all about getting deep into the dynamics of the trade. But not just a selection of the trade. Everything: from a selection of the trade, through trade management, invalidation price action, invalidation price setting, the rhythm of the trade to trade mapping. Let’s have a look at another example trader Harry shared with us.
This article is based on the video down below.
Journaling Templates
Context Of The Trade
Starting from the Daily chart, Harry has focused on the multi-week balance that has been formed in the Bund. He is highlighting the trigger price that can unplug the move lower, focusing on:
- “These lows are now very key, once broken, we should see a big move lower, nearly a 100 tick lower”
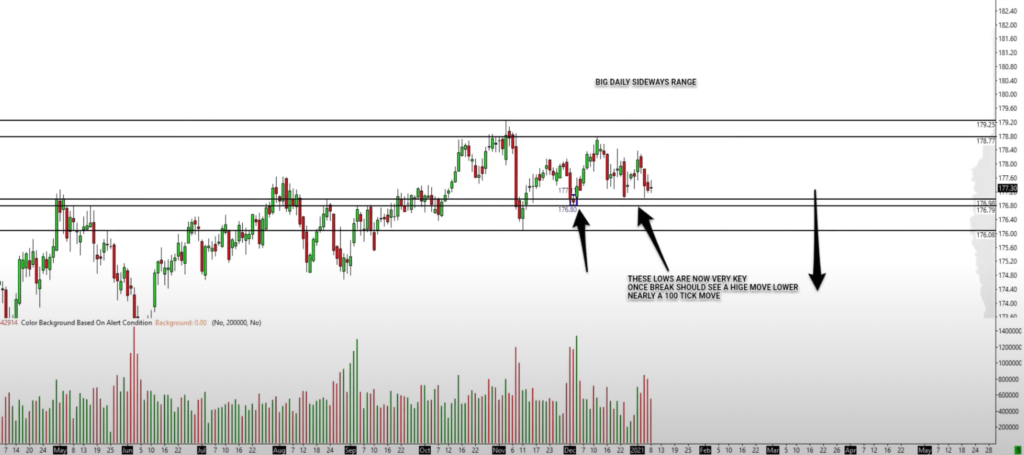
Being aware of how the Bund trades, 100 ticks is a lot. But highlighting first, the accumulated energy (the multiday balance) and what would trigger the move lower (break below the range lows) is an important clue.
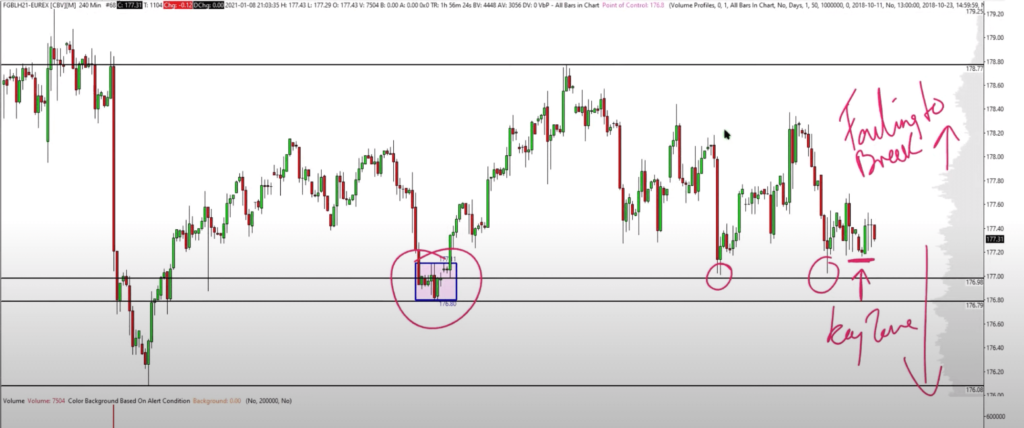
Down below we continue with another annotation. Notice how the clues such as the TIGHT BLOCK (pink) and then HIGHER LOWS (red circles) were highlighted. Noticing this creates a clue of a stop cascade. A move through those levels should trigger some form of selling. That’s why it is labeled as a key zone. Failure to break to the upside is another point that lot of energy is being built inside these lower prices.
Now is time to switch gears. A market profile comes into the scene. We will be looking at three timeframes:
- Weekly
- Daily
- Daily with cash and overnight session highlighted via different profiles
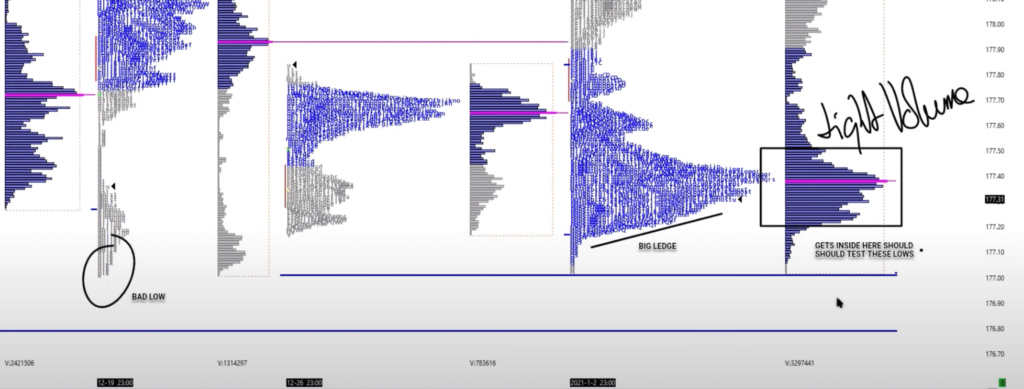
As you can see above, the main annotation was about “tight volume”. A lot of energy concentrated in a tight range can produce a nice move once the price escapes the range.
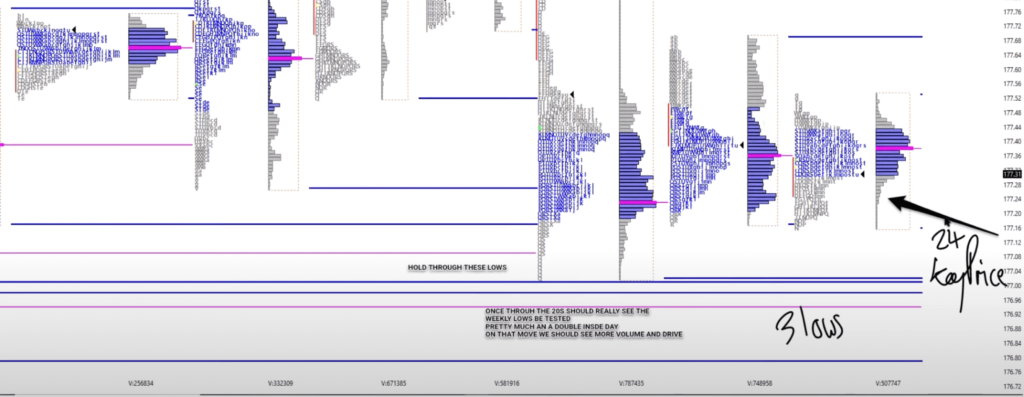
Zooming in on a daily market profile, we can see tails on the wider candle, that engulfs any candle after. The “3 lows” annotation signals, that the moment we start to trade into the tail, we might get a move down. Not necessarily quickly moving down, but a move that should auction to test the lows. The highlight from the journal is this:
“once through the 20’s, we should really see the weekly lows be tested”
With almost an inside day the previous day, the break should unlock more volume coming to the market once we get below the 24.
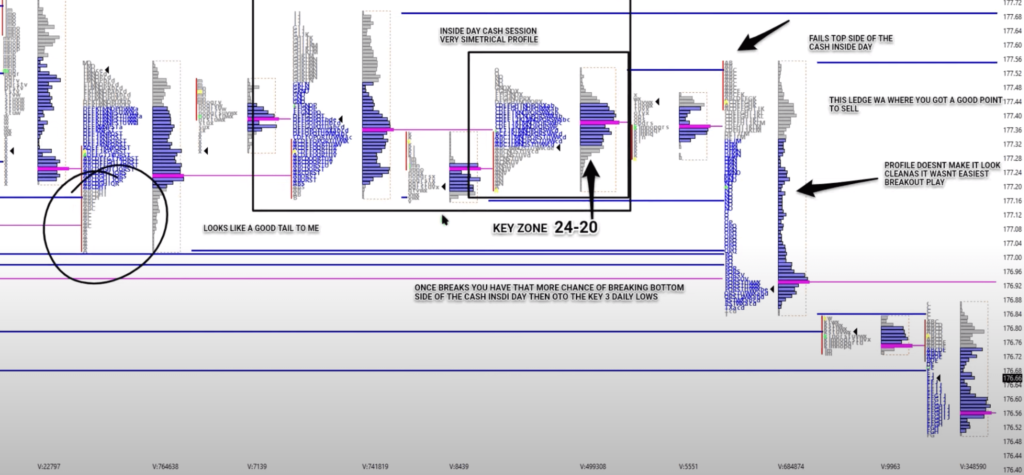
Closing out on the overall market profile analysis, comes this well-annotated view above. This is the chart AFTER the market made its move. Harry is not only collecting charts after the fact but also what data points he had prior to taking the trade. Observe now for yourself all the consolidated clues he has highlighted into the chart. Is there anything we have not picked up in our analysis?
Trade Access And Execution
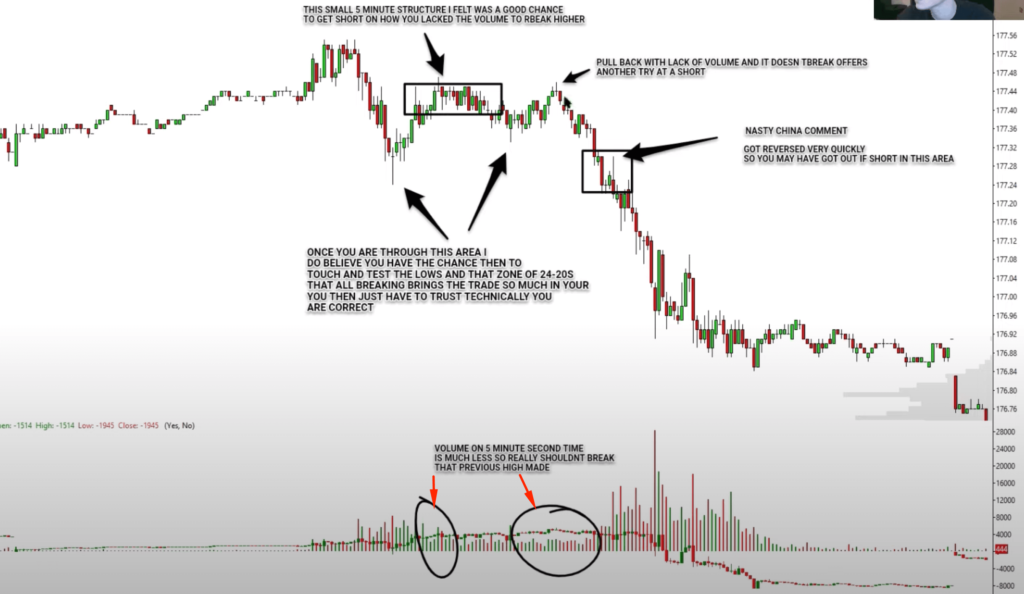
Getting now into the execution space, it is all about mapping how the price action acted ideally as close as possible before it broke or at the breaking point (20s zone). These are the clues that stood out:
- small 5-minute range structures
- the relative volume between small 5-minute range structures – higher vs lower volume -> signals possible weak hands that are unable to lift the offer higher when the market came back into the previous tight range
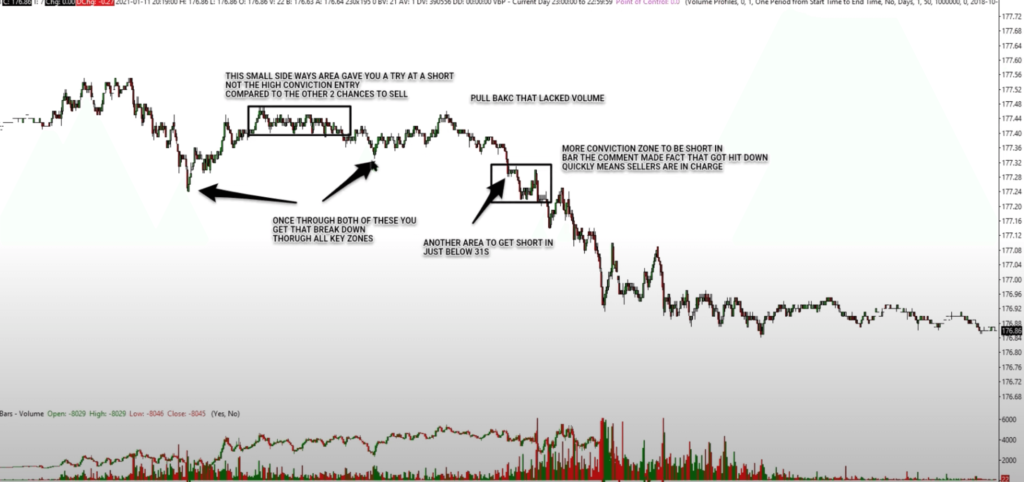
Both of these ranges were possible access points prior to the break. After we broke the key 24 levels. There is gonna be a certain rhythm to price action.
Now it is showtime. We have mapped the trade. It is all about our access and ability to HOLD the trade. One of the hardest things in trading futures. Sometimes we must tame our ego trying to use large size and rather sacrifice the wider stop. Why? Because clearly, Bund won’t necessarily offer a straight-line move and we need to constantly ask ourselves: where are we wrong? If the answer is 10 ticks away from this price, we must adjust the risk. The smaller the margin of error, the more difficult it is for us to hold and any move that will try to squeeze us little, will be an emotionally draining exercise.
Looking at the rhythm of this trade, it is clear that trade management was not easy. The market moved down in a zippy fashion, making a move down, then making a 50% pullback on a swing it has made. If you are not prepared for this, or your margin of error is small, you can get frustrated, be stopped in trade, and lose conviction with the idea. Therefore being honest about appropriate stop size and risk size is an absolute must.
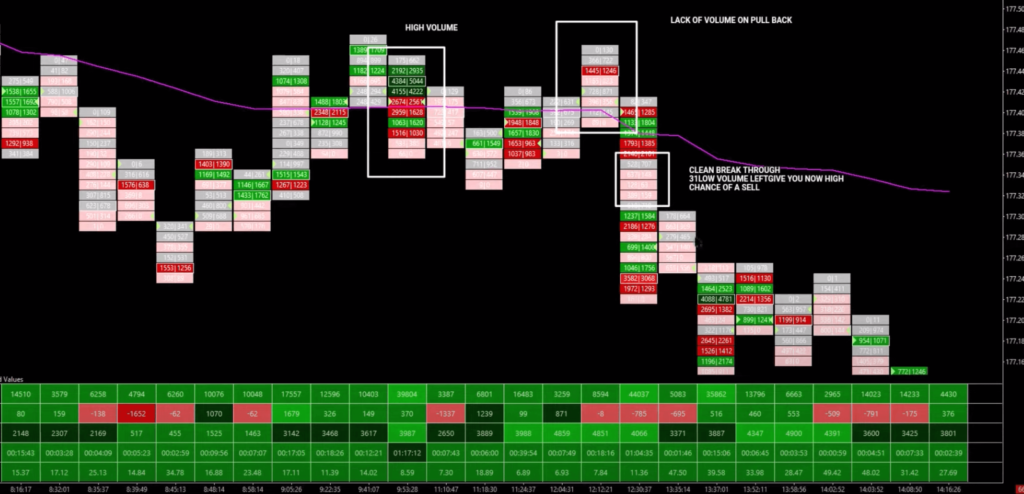
Here is the last view on the Footprint chart. Btw: if you are into Footprints, don’t forget to check our Footprint course, where you can learn how to read it like a pro. Looking at the Footprint, Harry has highlighted several clues. The most important one is the HIGH VOLUME (the first white box on the left). The relative volume is something that we have discussed. That is your ZONE to access the trade early when the volume is light.
The second clue is a clean break of the 31 low is now giving you a chance to sell. An area, where stop placement is above the high of the low volume block.
Trade Clues Summary And Takeaway
Last but not least. In order to internalize the clues that led to this rade, Harry has created this list that summarizes clues about the overall setup (right click and open the image in a new tab to see it better):
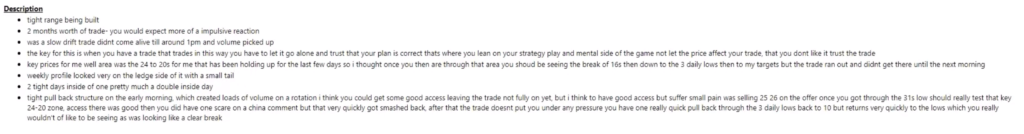
It is important to remember, that everyone has a different journaling style, but the key takeaway is this: you journal, you annotate because you want to improve your ability to deeply understand the trades you are taking in the future to maximize your conviction, RR, and management of your future trades.
Thanks for reading.
If you liked this type of content, you might check these videos as well:
- How To Manage & Exit A Failed Breakout Trade
- Sign Of A Breakout About To Fail – Price Ladder Trading
- Market Profile Trading: Better Breakouts with Context and Volume Profiling
Do you like what you have been reading? If you would like to improve your game, definitely check one of our courses that teach you all the techniques presented by AXIA traders from a market profile, footprint, or order-flow. If you are someone who likes to trade the news, we have a great central bank course. And if you are really serious about your future trading career, consider taking AXIA’s 6-Week Intensive High-Performance Trading Course.
Thanks for reading again and until next time, trade well.
JK