Footprint Strategies You Can Apply In Your Trading Introduction
In this article, we will discuss different footprint strategies you can apply in your trading. Specifically, we will bring the comparison of the footprint to the market profile, discuss the effect of the footprint in a thick rangebound market and explain different ways how footprint color coding can help your own trading style. We will introduce three footprint trading strategies and explain in what ways you can extract clues from the micro-structures of the market. For those of you that are not familiar with a footprint, definitely check one of our workshops that have been made public (part 1 and part 2) on the topic of footprint. If you are serious to step up your footprint trading game, don’t forget to check our course as well. Ok, let’s get to it.
This article is based on the video down below.
Footprint Strategies
Introduction
This article expects some level of understanding of how to read a footprint chart. If you are new to footprint, I recommend you to follow the links from the introduction of the post. For those that are a bit familiar with a footprint, a short recap.
Footprint represents a view into a bid x ask interaction for each price. For every price, buyers and sellers transact with each other. The function of a footprint is to give you an insight into how much volume has been transacted at the side of the buyer and on the side of the seller. Understanding the footprint dynamics can give you an edge into when to act and when not to act at the micro-level. This is crucial for precision entries and optimizing your stop-placement.
Now let’s have a look at three different footprint strategies you can use in your own trading.
Strategy 1: Micro Double Distribution Footprint Strategy
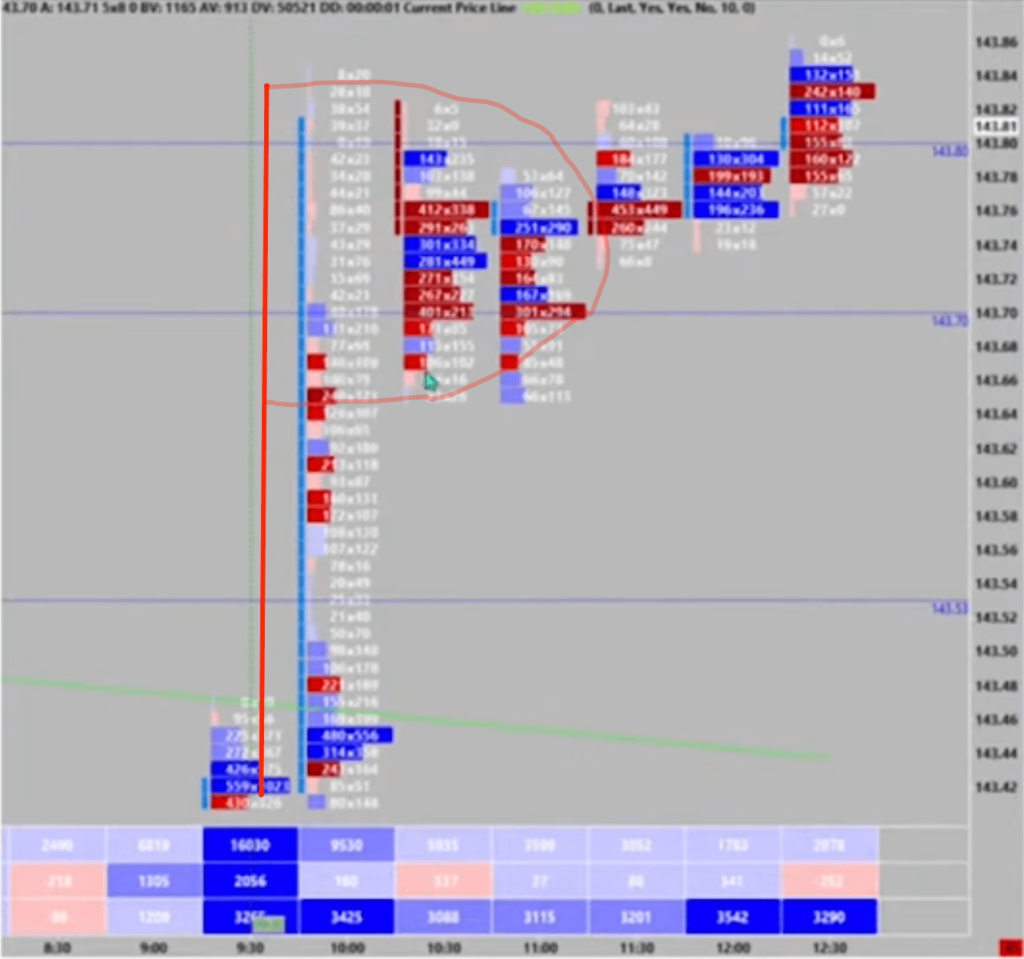
Since markets are fractals, footprint property is the same one as the property of volume profile but just at the lower scale with more detailed insight. What do we mean by that? Imagine a strong move up (see picture below). As the move goes up, some short-term shorts are forced to liquidate. In the volume profile terminology, a P shape is created. The same applies to the footprint, just at the lower scale. Now, given other tools like price ladder and general market profile landscape, you can monitor where the footprint starts to absorb volume into the top of the P shape and place its stop below the edge (assuming you are getting long, you want to get as close as possible to low volume node, the bottom of the bulked volume at the top of P).
Now, looking at the footprint, the market basically created a double distribution move on a smaller scale and you can use the understanding of where the volume is forming in real-time to manage your risk and place your trade.
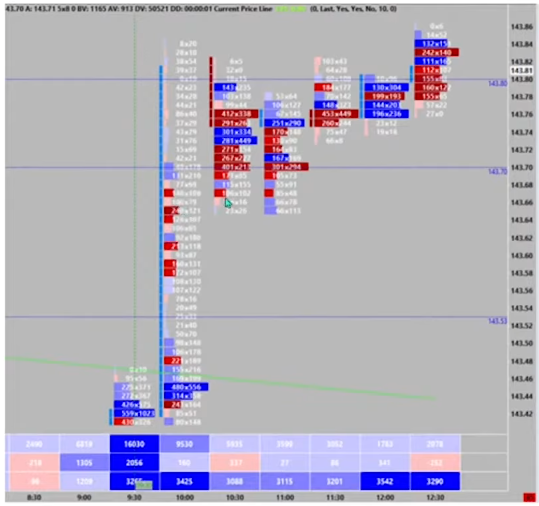
Down below is an example of what we have just described. The green arrow is the low of the bottom of the P shape. The main volume has been built above the green arrow. That is where the value has been accepted. That is the spot where you want to start thinking about executing the long trade.
Strategy 2: Micro Range-Bound Footprint Strategy
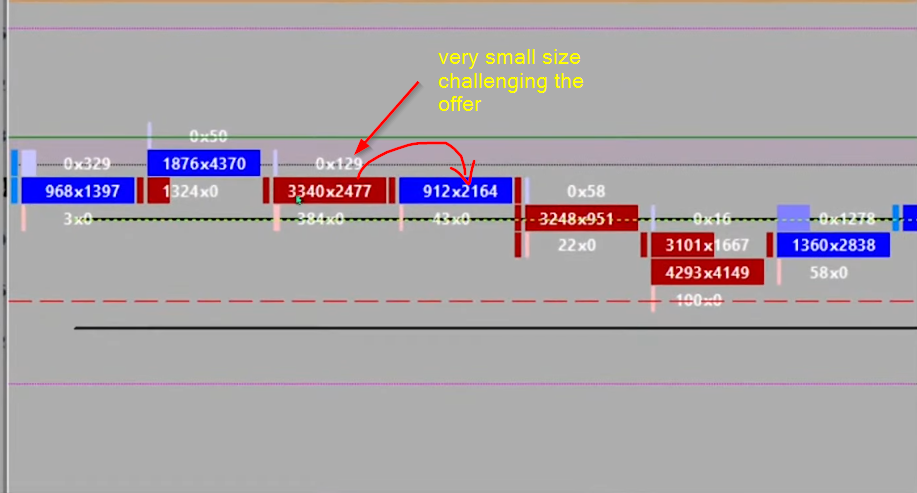
Here is another look at the footprint chart. In this case, we are looking at Bonds. Bonds in general are thicker markets. A lot of volume is exchanged between buyers and sellers therefore they tend to move less than other thinner markets like Gold. This is important. This dictates how volatile the actual market is. If we are aware of this, we can use that information in our favor. Any point of reversal can be our signal to start observing the footprint and watch for the volumes being exchanged. When we spot that one price is exchanging very large volume and the other has no interest to exchange much of a size, this can be our trigger signal, that directionally that size is weaker and use it to our advantage.
Let’s have a look at what I mean using the image below. Here you have a footprint of how much has transacted between bid and offer, 3340 x 2477. Now, look at how much volume has transacted one price above: 0 x 129. Do you see that comparison? Buyers had almost no interest in lifting the offer with just 129 contracts trying to lift the offer. Given the other clues, this can be your access signal to get short with a tight stop.
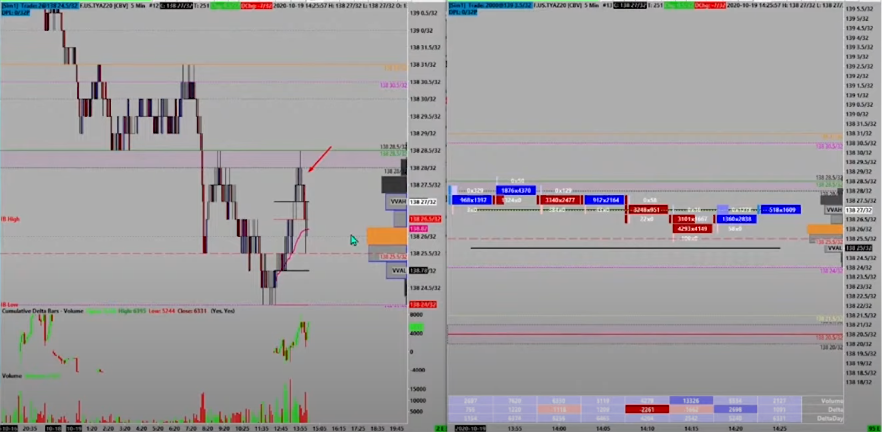
Down below is the overall view of a candlestick chart (left) and footprint chart (right). We can see, that our bear zone (pink zone on the left side of the image) had a nice confluence with our access signal that we have explained above.
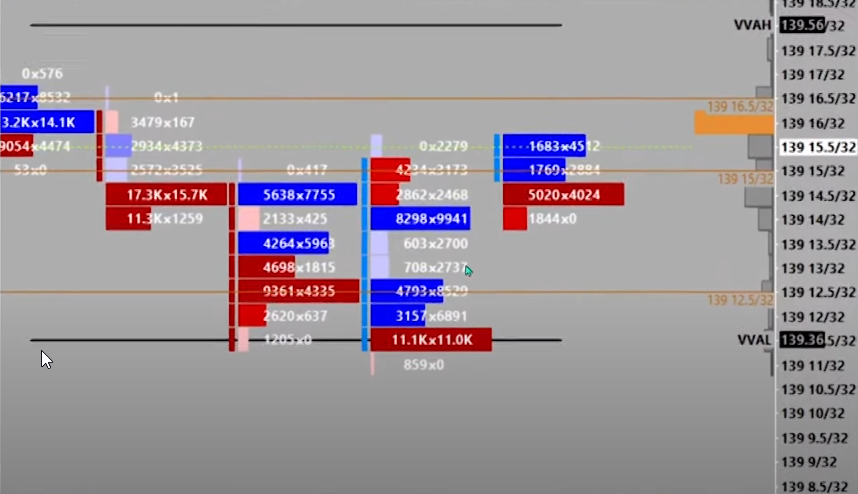
The same can be applied for a long reversal. Ideally, you want to see a confluence of other clues coming together. In this case, 11.1k x 11k contracts transacted (see image below) at the low of the range. What happened at the next price lower? Only 859 contracts hit the bid in 0 x 859 display. Taking into consideration that just one price above 11x more contracts have transacted (11k vs 859), using the price ladder pace (not included), we could have seen a personality shift in action. This shift could have given you the confidence to initiate the trade and ride the wave of the unwind of all the sellers that got short near the bottom of the distribution. If you are not familiar with the price ladder lingo such as “personality shift” and “change of pace”, check our course where we teach you how to read the price ladder. Or join our free webinar to get a taste of what our 7 figure traders are using.
Sign up for the FREE Live Training below and get ready to take that next step right now: https://go.elitetraderworkshop.com/Free
Strategy 3: Footprint Color Coding That Helps Initiate A Trade
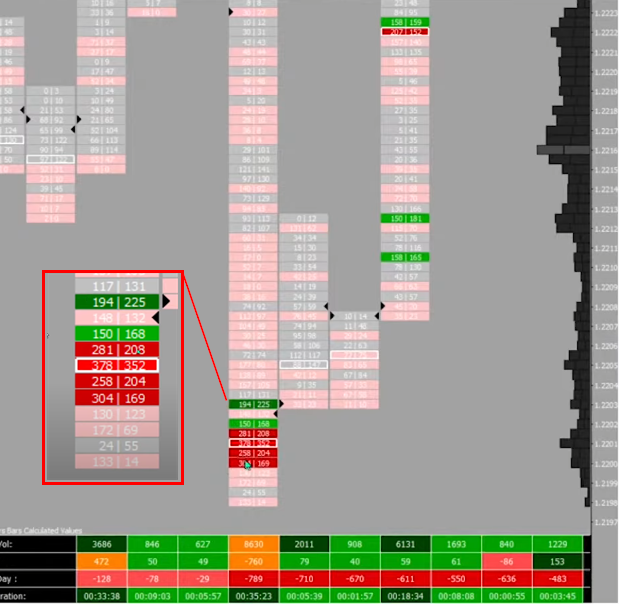
Although this is not necessarily a strategy on its own, using color coding/color highlighting can be very beneficial. Why? If you can make the volume delta stand out, your eyes can pick up the change much easier and give you extra confidence that this is the spot, where things are changing. Seeing this action can give you extra precision in your stop placement. In the image below, you can see, how after the larger drop on a tighter volume (pale gray and pink colors), green and red appeared highlighting increased volume delta with green color representing buyers being aggressive and red color representing sellers being aggressive. This aggression stood out much more than in all other previous prices in this instance aka rotation. In general, the multiple red-colored boxes after a large move down represent an absorption. Buyers were willing to passively absorb the aggressiveness of sellers. An ideal time for reversal when other clues aligned. What happened next is clear from the chart. This could have been one of many clue, to get long.
That is all for now. There is one important takeaway: footprint can give you precision in your access and stop placement. As always it is about combining the right tools together to gain the biggest possible advantage in the market.
If you liked this type of content, you might check these videos as well:
- Footprint Trading Workshop – How To Setup, Interpret & Comprehend | Axia Futures
- Footprint Trading Workshop – Market Interaction & Scenario Analysis | Axia Futures
- How To Read The Footprint Chart – Advanced Trading Tutorial | Axia Futures
In case you are interested in finding out more about trader training to learn how to trade and explore other great trading strategies, check out our futures trading course that teaches you exactly that and more. Or if you want to really maximize your ladder execution, check out our price ladder trading course.
Thanks for reading and until next time, trade well.
JK