Exposing Price Sensitivity Of Intraday Traders – Introduction
If you are an intraday trader, there is a very high likelihood that you will also be a price-sensitive type of trader. In this post, we will be looking at questions that can lead to exposure of those price-sensitive intraday traders. The reason why we will be talking about this topic is to understand, what people’s positions can potentially give us a trade. If you want to understand how time, lack of patience, and failure to follow through leads to market opportunity, carry on reading. In the article, we will be using some of the market profile techniques and if you want to perfect these techniques, consider taking our market profile course.
The article is based on the video down below.
Asking The Right Trading Questions
In order to expose this concept of price sensitivity, we must first answer why intraday traders are price sensitive. Since we are all looking at the same market data, we can see where buying and selling is entering the market and these access points then become attractive for other intraday trades as the day develops. These locations can then become interesting pockets of liquidity, where stops are placed and where people are making their mind if they still like the trade they took early on.
Before we start exposing the other people’s trades, it is important to summarise questions we would like to ask and use them on a model example:
- Can other traders positioning become weaker and how?
- How is time working for and against market participants?
- Are other price-sensitive traders joining similar positions?
- Is there a lack of follow-through and failure to fulfill market expectations?
Let’s have a look at three examples below, that can better demonstrate how applying these questions to market can help us.
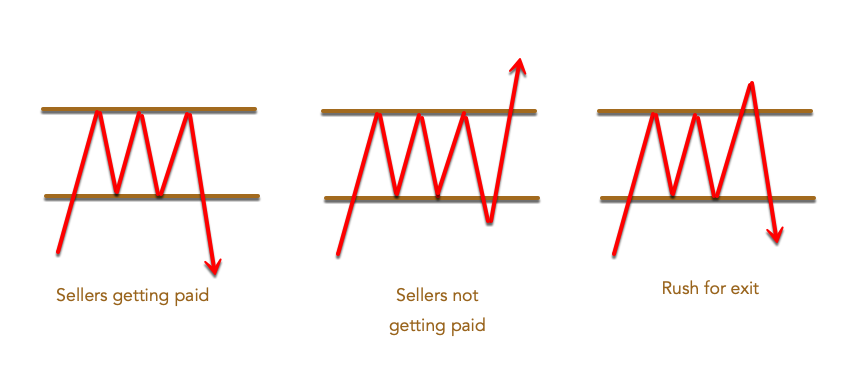
If you look at the above example, you can see three scenarios:
- Sellers getting paid – sellers patiently waited, more participants join the position and the market rewarded sellers with the follow-through move to the downside
- Sellers not getting paid – as sellers patiently waited, the market did not provide a follow through to the downside and they will be potentially running for the exit because they are not getting paid
- Rush for the exit – as sellers patiently waited, weaker hands got squeezed first to the upside but as the market did not produce any follow-through, sellers retook the ground again
So what is all this useful for? Understanding where intraday traders are joining positions can give you an opportunity. Understanding who is getting paid and who is not can give you an opportunity. By now, we are ready to apply these principles to the market example that happened in Oil.
Oil Trading Example
Trading Context
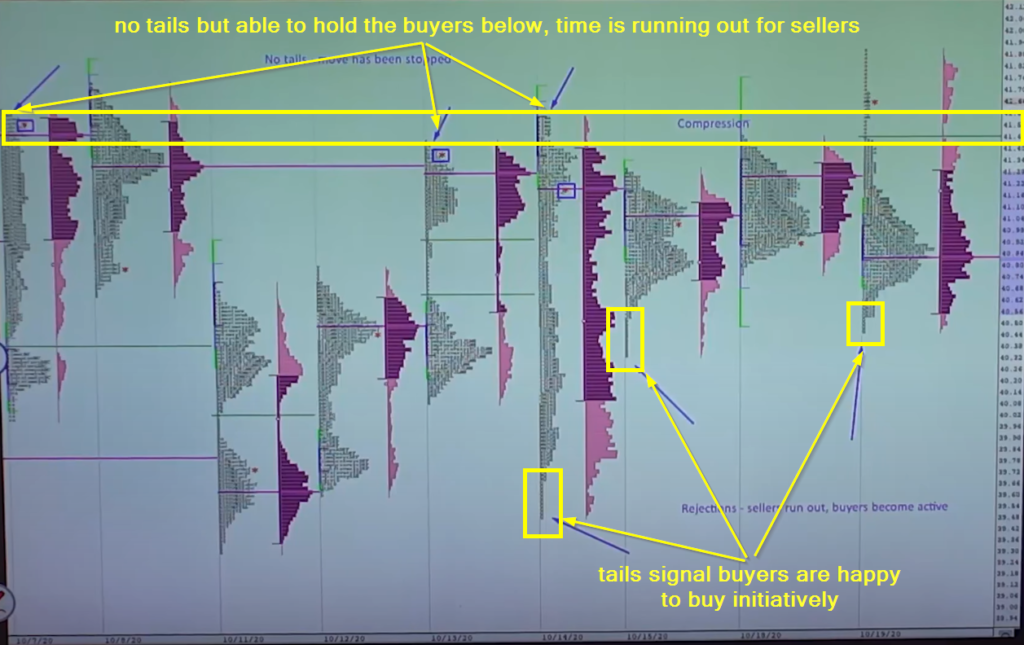
Down below we can see the market profile chart of the Oil. As we progress higher, slowly building compression to the upside, the market profile signals that the high is not creating tails and is producing poor high. On the other side, lows are producing tails that signal buyers are happy to buy initiatively. Time is slowly running out for sellers and the market is more and more getting positioned for a further move.
Zooming In
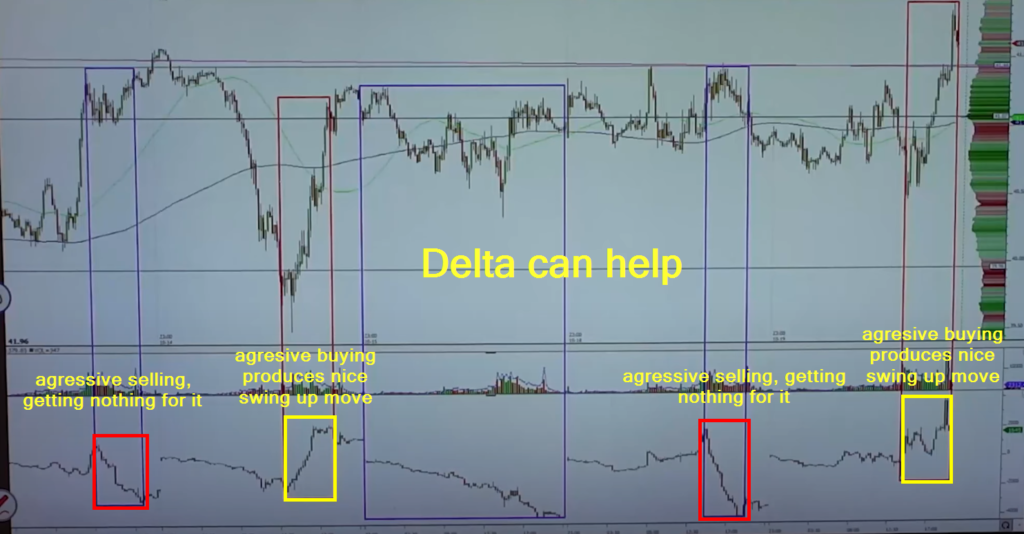
Now as time is developing this range, we have other tools that can help us. Delta. With Delta, in this case, we can look at the relationship between how delta moves and what effect it has on the actual price. In the image below we can see, how aggressive selling represented by Delta, is getting nothing in terms of the price movement. This is an insight move into the structure. Sellers are hitting bid, but the market does not produce an adequate response. Somebody is not getting paid.
With Delta in mind as we are zooming in, we can also see, that the tails represent the strength of buyers and poor highs represent cracks in the absorption. Although sellers are happy to absorb they are slowly running out of time.
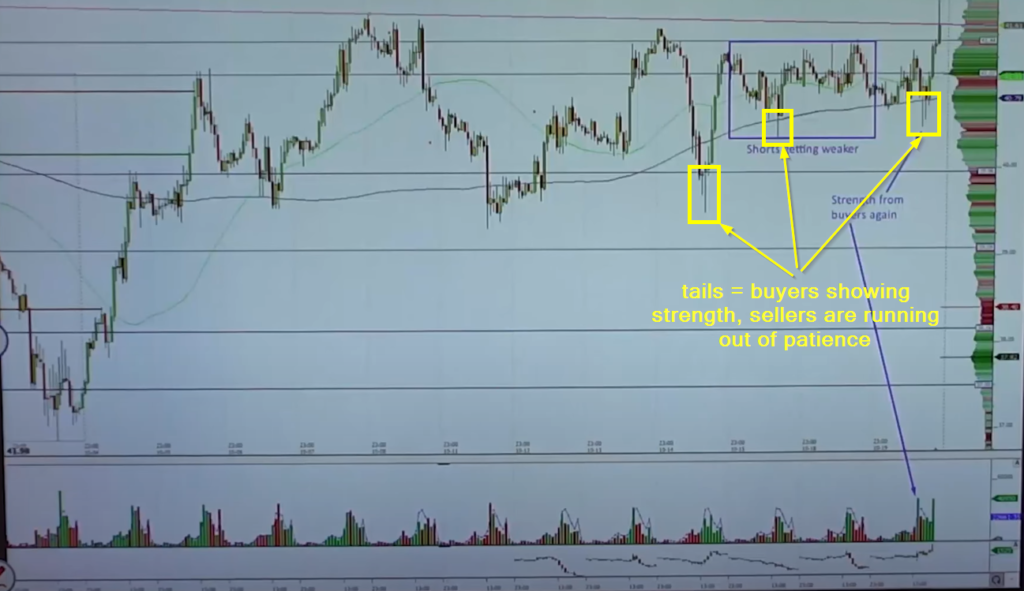
Connecting Tails, Time, Poor structure, One side continuously not getting paid and Delta can produce a very good understanding of how other traders positioning can give us a trade opportunity. In this particular example, Oil eventually broke to the upside as sellers could no longer hold their positions and rushed for the exit.
If you like our content and would like to improve your game, definitely check one of our courses that teach you all the techniques presented by AXIA traders from a market profile, footprint, or order-flow. If you are someone who likes to trade the news, we have a great central bank course. And if you are really serious about your future trading career, consider taking AXIA’s 6-Week Intensive High-Performance Trading Course.
If you liked this type of content, you might check these as well:
- Market Profile Trading: How to Trade a Profile Ledge
- Market Profile Trading: How To Trade The Failed Auction Setup
- Market Profile Based Trade
Thanks for reading and until next time, trade well.
JK