Best Strategies For Trading The Volatility Introduction
This article will discuss the best strategies for trading the volatility. We have seen it over and over again. When the market starts to pick up the volume during the highly volatile days, the order flow gives you much cleaner clues to get into the trade and stay in it. In this post, we will break down an example from the DAX and S&P500, and discuss the best strategies to trade these markets. We will break down examples from 2020 when the pandemic started and the 2022 Russia-Ukraine conflict. If you are interested in other strategies on how to trade volatile markets, definitely check our blog post on How To Trade Geopolitical Conflicts.
Strategies For Trading The Volatility
The article s based on the video down below.
Expectations
When we trade volatile markets, we need to adjust our expectations. Our trades that used to take a couple of handles, can now easily reach 10, 15, 30, or more handles. This means that you need to not only adjust your stops but also your targets. In simple terms, you are going to get paid more, but you will have to sit through a larger drawdown than you are normally used to. This means that you will experience a larger chop than what you are used to and that should not scare you off. It sounds simple and obvious, but for many, it is difficult to change their mindset and accept the environment. What happens next is that you get chopped by larger swings and face unnecessary losses. So the lesson number one is:
- when daily ATR increases, look at your intraday day rotations based on your timeframe and measure the size of the average rotation. You can do that again by using the ATR for the last 20 intraday candles. This way you will have a more systematic way how to measure the risk and set your stops correctly
- for targets using either price targets (next support/resistances) or ATR multiples. We don’t like the ATR multiples very much, because they do not represent the supply/demand targets but rather an artificial number where the market might get extended.
Now that you have the right expectations, let’s move on to the big picture.
Big Picture
Understand your daily and weekly levels. Where they are and how the market reacts to them. Usually, in times of high volatility, daily levels have a higher tendency to get respected. Breaks of significant daily levels can yield large daily swings, that in the normal less volatile conditions would not be possible.
Then when those levels get broken, the expectation is for a follow-through move. Not following every daily level break blindly but again, this is not your normal environment. The environment tends to get more directional and if more significant levels are broken, you can expect the momentum to pick up.
Remember, levels tend to react quickly. There is less time to wait for the confirmation therefore in general you must be more aggressive with your access to the trade.
Trade Examples
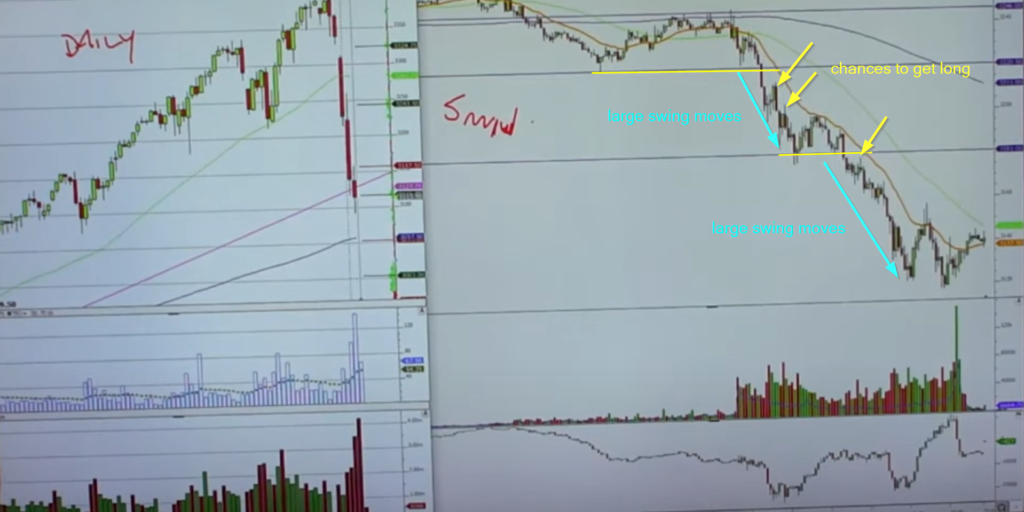
Down below we have two charts. First is the chart of the S&P500. You can see that after we broke the daily level, we started a very aggressive swing down. Pullbacks are being sold but also stronger intraday supports are becoming resistances. These flip zones (support becomes resistance) are ideal spots for us to enter and we must be aggressive, we cannot wait for the confirmation.
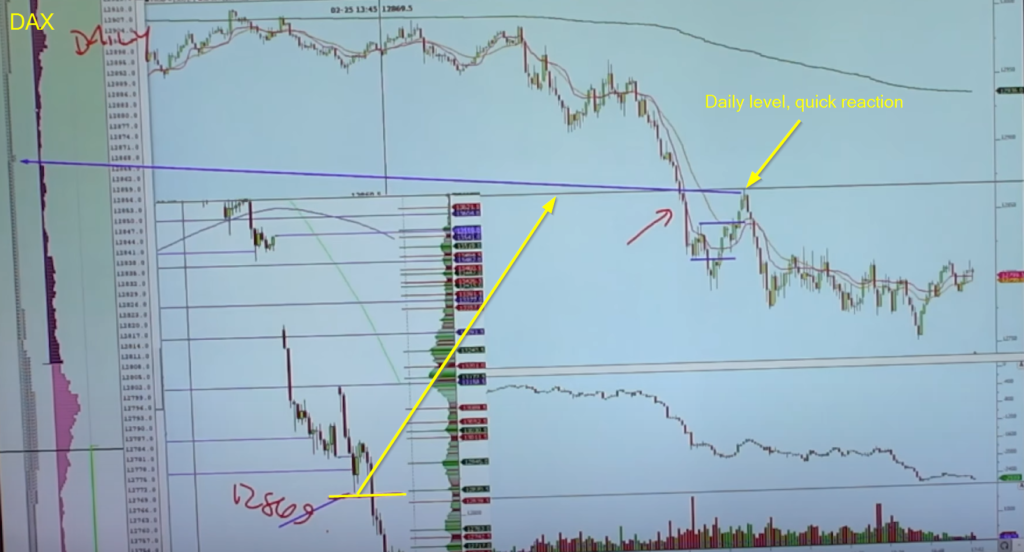
In the DAX example, we can see the daily level as well. Once we broke the daily level with the momentum, the pullback back to the level was a great opportunity for us to get short. As we have mentioned, in these conditions, we cannot wait for confirmation. The situation in which we trade has changed. Either we will get in on first touch and trade would hold or we would get immediately stopped out. The RR for this move is definitely worth it.
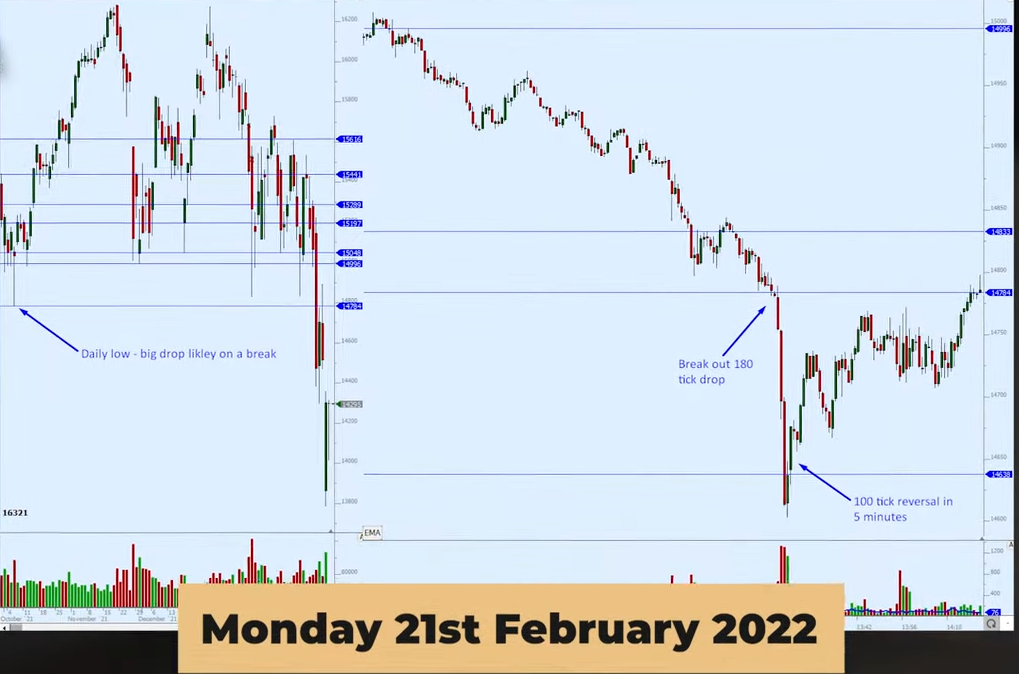
Last but not least is the example of DAX during the 2022 Russia-Ukraine conflict. In this example, we will use the chart from the video down below.
This volatile move is all about selling pressure, something that you won’t be able to see from the candlestick chart. That is why we use price-ladder to understand the flow better and have the best possible location for the execution. If you want to learn how we use the price ladder, don’t forget to check the free webinar we are running at: https://www.elitetraderworkshop.com.
The speed and the relentless selling were great examples of DAX breaking the daily level. Watch the orderflow here.
Trading Volatility Takeaway
Watch your daily levels, reactions should come quickly, and don’t wait too long for a confirmation. Don’t get trapped in the few ticks here and there only to encounter larger losses when you are wrong fast. The name of the game in the highly volatile environment is: “Be aggressive at critical daily levels and hold through initial chop for larger moves”.
If you are interested in trading highly volatile events these are the best resources to get you started:
- How To Trade Geopolitical Conflicts
- Elite Trader Price Ladder Scalping In Bund
- Elite Trader Price Ladder Scalping
- Trading Moderna Vaccine News Across Multiple Markets
- Global Macro Trading: How to trade the ECB Rate Decision
- Trading the Fed Rate Decision
Thanks for reading.
If you like our content and would like to improve your game, definitely check one of our courses that teach you all the techniques presented by AXIA traders from a market profile, footprint, or order-flow. If you are someone who likes to trade the news, we have a great central bank course. And if you are really serious about your future trading career, consider taking AXIA’s 6-Week Intensive High-Performance Trading Course.
Trade well.
JK