What is a Market Profile Ledge?
A Market Profile Ledge is visually easy to spot. It shows up as a line of TPOs (letters) all at the same price with little below it – for example 4 TPOs at 80 with just 1 TPO at 79. The important part is what this is telling us: essentially it means that the market has been forcibly stopped at a one price and therefore has not completed the auctioning process. Imagine at an auction every time the price of a certain item hits $100 the seller stops the auction and sells to the person bidding $100. This creates an artificially low price and does not complete the auction; an auction should end when the last buyer is found. If this auction was a Market Profile it would show a TPO ledge at $100 – time and again the price hits $100 but does trade above, even though traders may be willing to pay a higher price they are not able to.
What Does This Mean For a Market Profile Day Trader?
This a trading opportunity, the ledge at some point should break creating a delayed trade opportunity. The skill is recognising when the the break is on and whether the trade can be taken with appropriate management of risk
Trade 1: Profile Ledge Break
Once a market profile ledge has been established it gives a clear target (break the ledge to complete the auction) the difficult part of it is finding an entry point so you are already in a position when the profile ledge breaks. Remember the ledge should break to complete the auction so being in before it gets there means that if the ledge only breaks by 1 tick you can still get out for a profit. Understanding how and why the ledge has been created will enhance the ability to to assess not only how to play the break but also what is likely to happen after the break. In weekly mentored session on 1st July, I look at a ledge formed by buyers trying to stop a move down in GBPUSD and the steady break from mid range, where a bounce from the ledge meets resistance giving a passive entry for the break and continuation as the buyer at the ledge is no longer there. This contrasts with a profile ledge break in Bund that had been created by selling stopping a bounce, once this ledge breaks the play can come as a passive entry for a grind higher. Recognising these distinctions will help you learn to trade and categorise different ledge break and other profile patterns.
Trade 2: Positioning Reversal Trade
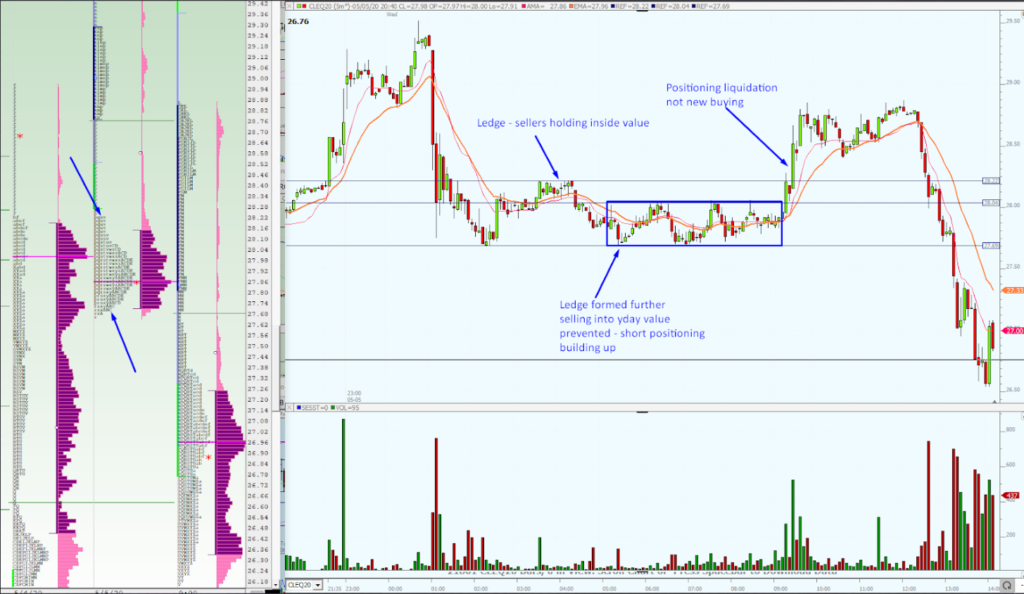
There is a flip side to spotting a ledge and learning to trade the breakout. Because a ledge is a relatively obvious reference point, it is easy for participants to start anticipating and positioning for the break. This leads to a lot of short term (day traders) all waiting for the same outcome, all with similar stops. If the ledge doesn’t break there will be a point where those traders scramble for the exit creating a fast move in the opposite direction to the ledge. As can be seen in the image below, shorts in Oil, playing for the ledge break to continue a move down, liquidate on move up through the highs of the recent range. The key to trading a move like this is, first, learning to trade the ledge break which will increase understanding of how others will be trading the same trade, and where their stops are likely to be, then comes the liquidation order flow – as pace suddenly picks up a trade can be entered to break the level where stops are expected to be placed.

I’ll be back next week with the next installment of Why Day Trading Is Not Simple Part III. Part I and II can found here
Richard.
Learn To Trade Market Profiles & More
If you’d like to learn to trade futures and develop your career as an elite trader then start now with one of our Trader Training courses on offer. Our flagship 8 Week Career Programme is the most immersive experience available and can be attended live on our London Trading Floor or from anywhere in the world as an online trading couse. It is the most comprehensive futures training programme from within the proprietary futures trading industry and is based upon years of successful in-house skills development with top performing traders.


