Market Profile Ledge Introduction
In this article, we will look at how a trader can use market profile methodology to trade a market profile ledge. Although the title might sound sophisticated, the ledge is basically an area where price stopped and formed two or more consecutive TPO letters (using market profile terminology) at the same price level forming a flat ledge. If this sounds familiar to support and resistances (which are in great and different light explained here), you are not far from the truth, but it is not the same. Support or resistance level is created anywhere, where the price was visibly rejected at least once. In terms of the ledge, we are looking for at least two rejections (2 TPO’s) using market profile terminology. The benefit of the market profile is that it gives us consistency in looking for these market profile ledges in the market.
In case you wanna get the full context of this article, I highly recommend you watch this video that goes into detail what this article will cover.
Now let’s have a look what market tools we will be using for generating trading ideas.
Market Tools For Trading A Market Profile Ledge
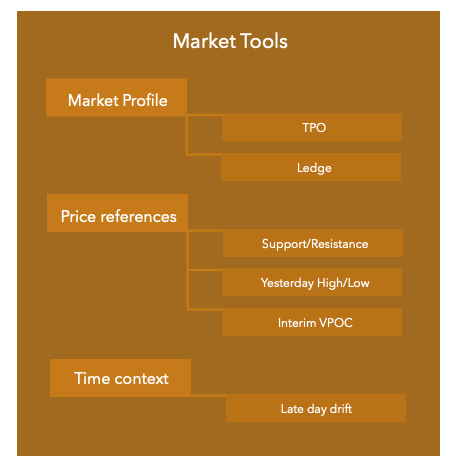
- Market Profile
- TPO – A Time Price Opportunity (TPO) is a basic unit displayed as a letter on a profile chart. Each TPO represents a point of time where the market touches a price and as a default is set up for 30 minutes time interval per letter. Every price that is traded within each 30 minutes interval is marked with this letter.
- Ledge (current/recent) – an area where price stopped and formed two or more consecutive TPO letters forming a flat ledge.
- Price references
- Support/Resistance
- Previous day High/Low
- Interim VPOC – VPOC that has been formed intraday, for example in a range that developed over the length of the trading session
- Time context
- Late day drift – price movement that can be characterized as slow (grinding) but a directional move that happened later in the day
Trading Ideas Using Market Profile Ledges
The scene for this trading idea is set, now let’s dig deeper what really happens when market profile ledge is formed. From market profile theory, the ledge represents a point when price discovery has been prevented and the auctioning process was stopped. This stopping of the auctioning process is telling us, that we have yet not found the final buyer or seller. In other words, we have not yet found a point in which either buyer or seller is not willing to transact trade anymore (a concept that is in more depth explained in this video discussing failed auctions).
The logic that is behind this stopping of an auction process is that it should get eventually resolved trading through the price where the ledge is formed. This creates an obvious and visible reference point on a chart, that can be later used in a variety of trading strategies.
It is also important to remember, that ledges are areas where primarily short term market participants (intraday traders) are positioned around. The longer it takes for the ledge to form, the higher likelihood that the ledge will be traded through and the auctioning process eventually resolved.
We will now look at these three trading ideas for trading market profile ledges:
- Breakout Through The Ledge
- Resolved Ledge As A Later Reference Point
- Post Liquidation Breakout
Lets have a look what I mean by that.
Trading idea 1: Breakout Through The Ledge
The most obvious yet not so easy to trade is the breakout trade through the ledge. The problem with this trading idea is that not every ledge is formed equally and therefore breakout is a 50/50 proposition. What helps here is again the context. Questions such as:
- How did we get to the ledge? With momentum or grind move?
- From which point was the move towards the ledge initiated? From a strong rejection tail, compressed move out of range or from a weak lack of momentum?
- Time of the day? Are we trading near the ledge by the end of the day or early in the day?
- What was the reaction near the ledge over time? Was it a strong rejection or weak bounce that gets even weaker every time we get closer?
- Where is the ledge positioned on a chart? Is it near long term extreme that might trigger move where bigger time frame participants might step in and move the market even more or is it in the middle of the range?
Answers to these questions can give you clues and build context for your trading idea, increasing your conviction of trading the breakout through the ledge.
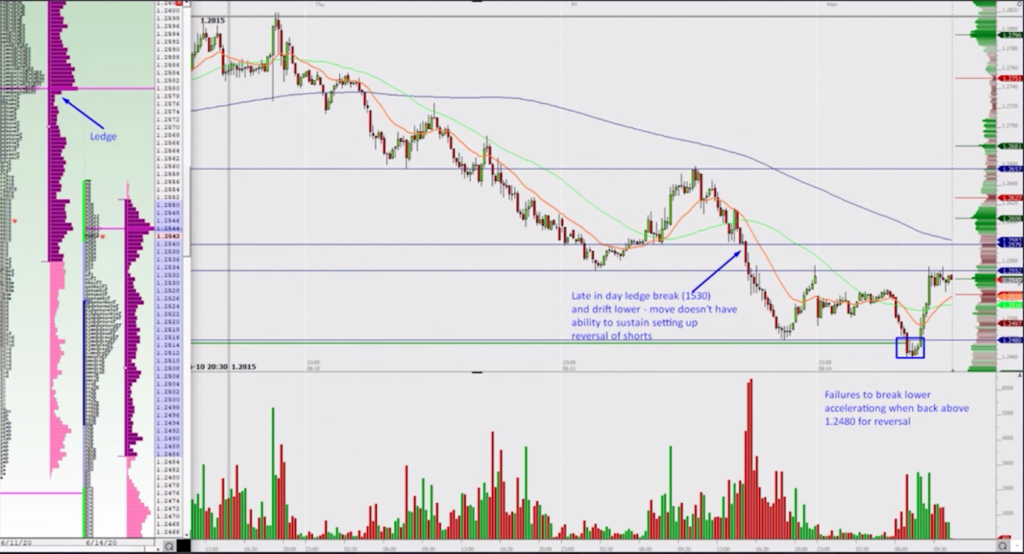
Here is an example of a ledge that has been formed over the course of the day and was eventually broken later in the day. If you have mapped this trading idea in bigger detail, you could find similar opportunities in which if the ledge was formed and broken later in the day, it created this late day drift lower which eventually turned into different idea and reversal type of trade the other day.
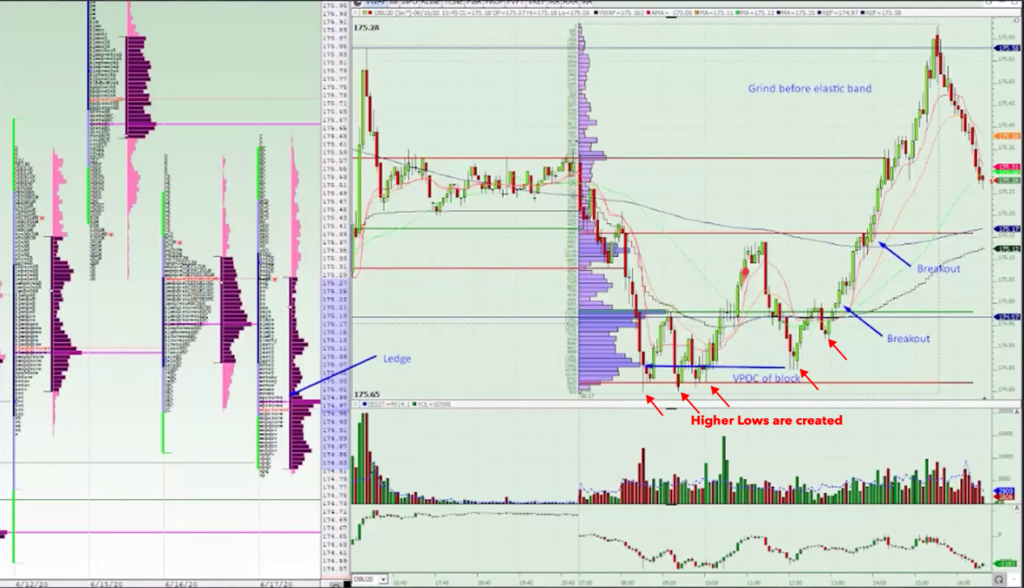
Similar to the example above, you can see an area, where the market is trading the ledge from both sides building context for the potential breakout trade. Over the European session, this ledge is formed and the market left us clues to build our context. We can clearly see, that the price has been tested from both sides, compressed range and interim VPOC has been formed. Also, note how higher lows have been formed and given multiple chances for the market to push price lower, market has failed to do so. Plus all of that coincides with the previous day low. All these clues combined together can then as the day develops create for you trade idea which you can execute with higher conviction.
Trading Idea 2: Resolved Ledge As A Later Reference Point
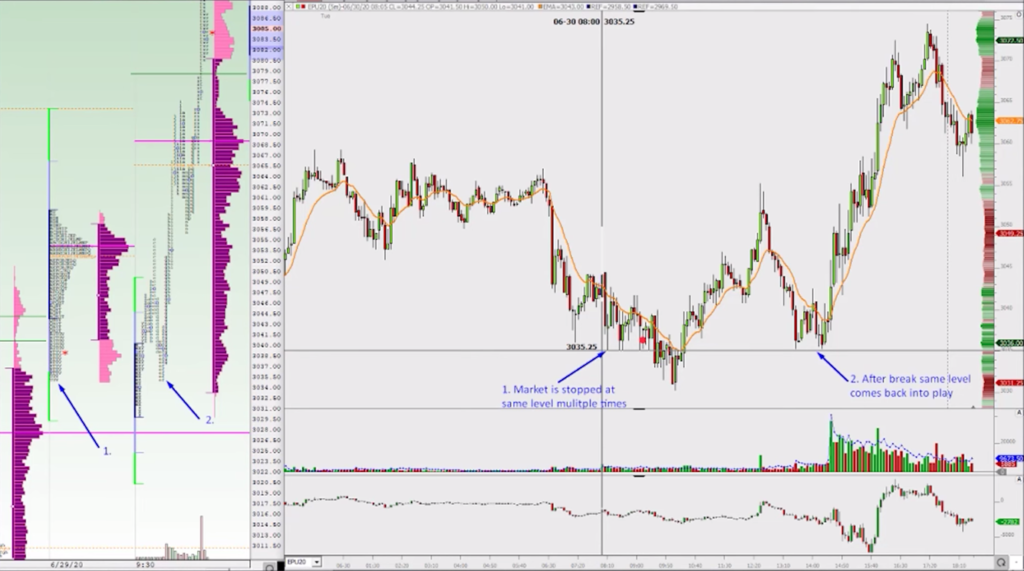
In this situation market eventually broke the ledge but was unable to sustain the break and reversed the move. The reversal lasted only temporarily during the European session and returned back to the original reference price where the old resolved ledge was formed. Given the short term participants have a good memory, this inside day price reference point (our ledge) acted again as a point of rejection. Double bottom was created here and the market finally moved and initiated a move creating new highs of the day from the ledge. If you would have looked at this level for price patterns, you could use this resolved ledge reference price point for trading idea towards the upside.
Trading Idea 3: Post Liquidation Breakout
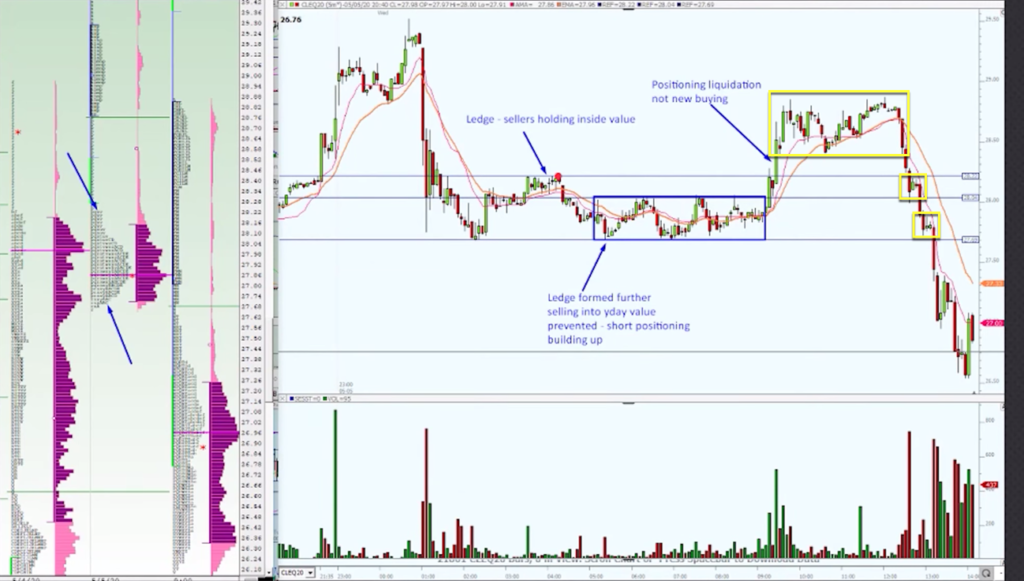
In this final example, we were trading inside yesterday range and short term market participants created a market profile ledge during the Asian trading session. Over the course of the session, the sellers got more and more frustrated because the market tried to break through the ledge three times with no success. A positioning of shorts has been built in this compressed range. As the move could not resolve itself over the Asian session, the market eventually moved the prices the other direction causing these short term sellers to unwind their short positions triggering liquidation move to the upside. This liquidation move moved prices higher, but understanding that there is a decent likelihood that this higher move is a liquidation type of a move rather then strong buyers stepping in, you could wait for the move to end and then look for an area of a reversal to get short again. To find your access. You could potentially use three access points (highlighted by the yellow boxes) to get back in short and at minimum have a clear target of the previously unresolved ledge as a target. You can decide there based on a reaction if you would cover the trade or let the trade continue based on the reaction post-breakout of the ledge.
Key Takeaways For Trading Market Profile Ledges
To summarise this article, I will use a phrase that is used a lot in our articles: “Context is king”. Understanding that market profile ledge is basically an area where price stopped and formed two or more consecutive TPO letters gives you a clue how to spot a trading opportunity. But using market tools such as time of the day, type of auctioning process around the ledge, and how we got to this ledge build your conviction on how to trade it. Also, it is worth keeping an eye on historical price reference points where the ledge was already resolved in the past. When market ledge is temporarily not resolved and position is unwinded, ask yourself if new market participants are stepping in or old participants just liquidating their positions. Questions like these will help you build your narrative, access point, and eventually build conviction to trade these market profile ledges with size. The important thing is to make them your own and build strategies (like the ones we teach in our market profile trading course) that make the most sense to you so the next time you see them, you can execute them without too much overthinking.
In case you are interested in finding out more about trader training to learn how to trade and explore other great trading strategies, check out our futures trading course that teaches you exactly that.
If you liked this type of content, you might check these as well:
- Market Profile Trading: How to Trade a Profile Ledge
- Market Profile Trading: How To Trade The Failed Auction Setup
- Market Profile Based Trade
Thanks for reading and until next time, trade well.
JK


