Trading Clues In Market Profile Structures Introduction
In this blog post, we will be looking at the trading clues in market profile structures. We will review four different market profiles and try to extract clues that can be later composed into tradable strategies in your own trading. If you are a frequent reader, you might have noticed that the purpose of these posts is to extract value from the Axia Futures videos in the form of actionable clues. If you like this article, don’t forget to check our previous post:”Trading Initial Balance Break Using Market Profile“. Let’s have a look now at DAX, German Bund, S&P500, and Gold.
This article is based on the video down below.
Market Profile Structures
DAX Market Profile
Down below we have a chart of German DAX equity index. From the structure, we can see that market has moved down in the recent sessions and now has put in a V shape formation. This is our first clue (bullish). Second, the day before the current day has created an inside day (ISD). Again, this is a clue about energy concentration. This clue is neutral, but any side that will have a follow-through will have this clue behind as fuel. Now as the day opens, we have a gap up (bullish clue). See the left side of the chart down below. With a tight initial balance after gap-up (bullish clue), we have a possibility for the market to knife through the stops above. It is all about the open and the opening flows. Let’s recap the list of clues you can take away:
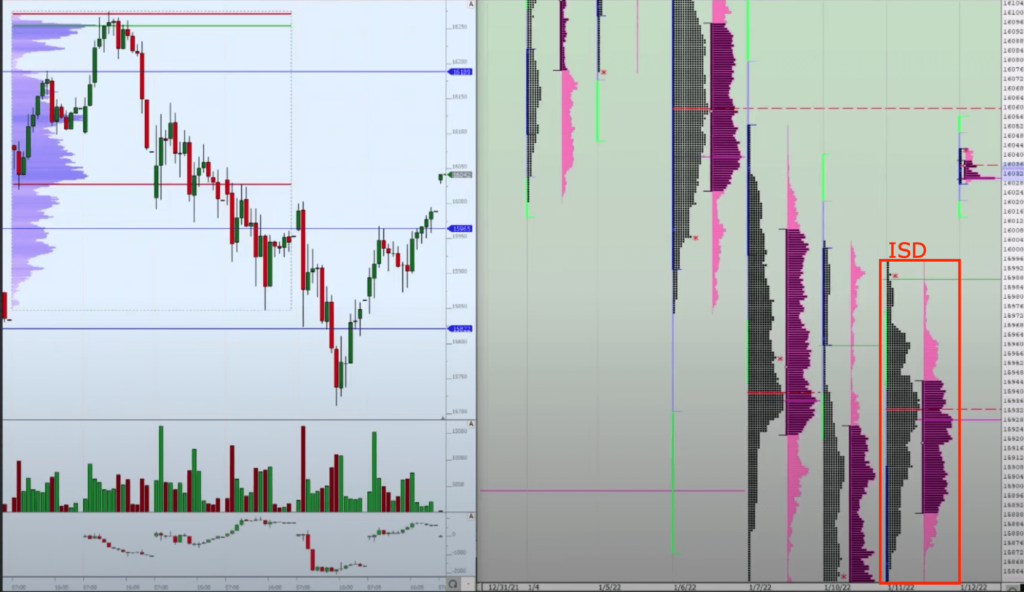
- Clue list
- V shape (bullish)
- ISD (neutral tailwind)
- Gap up (bullish if holds)
- Tight initial balance after Gap up (bullish if holds)
- Stops above to trigger stop cascade run (bullish if triggered)
Primary scenario: if the market provides above-average opening flows at the open, and is able to break the IBH (Initial Balance High), we might see a directional move higher to trigger the stops above.
Bund Market Profile
Looking at the Bund chart, we have a one-time-framing downward sloping chart (bearish clue). Even though the trend has been broken, we can see that market still attempts to break lower but starts to run out of steam – see the daily tail (bullish clue). Since we are at the daily swing low, this is a critical location for buyers to step in (bullish clue) after sellers might be tired. Judging from the structure, we are nearing two possible scenarios:
- a) reversal
- b) continuation and follow-through
Now let’s summarize the clues and create a possible primary scenario.
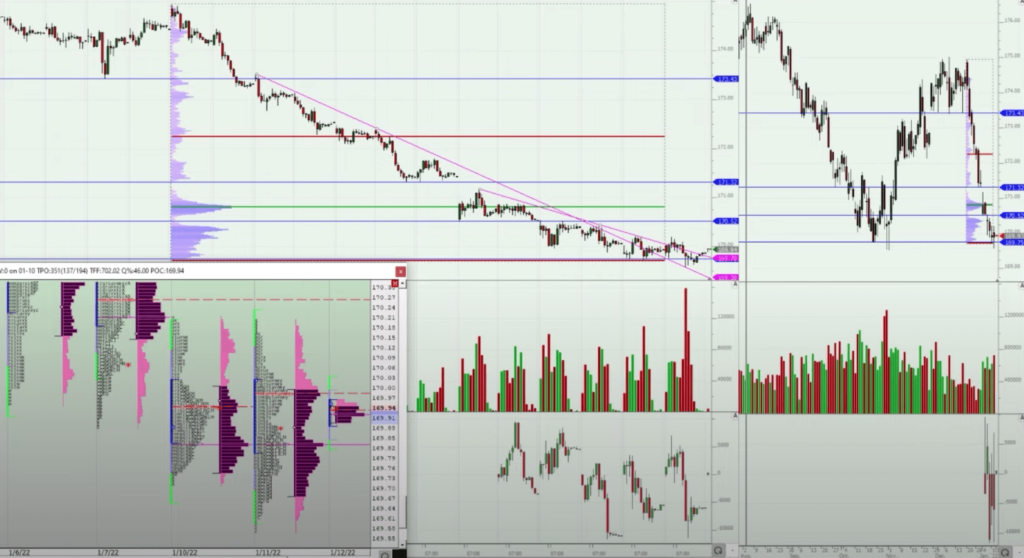
- Clue list
- Downward One-time-framing (bearish)
- Daily tails at lows (bullish)
- Location at weekly swing low extreme (bullish)
- Value not decisively shifted higher (bearish)
Primary scenario: wait and see for a shift in value either lower (break and follow through lower) or higher for the assessment of the next scenario.
S&P 500 Market Profile
Given the option expiry week, this presents the first clue. A clue that guarantees higher than average volume flows (neutral clue – tailwind). Looking at the tails/V reversals (blue arrows), these signal a rapid change in positioning and short coverings (bullish clue). With the current location, there is a decent cave to be filled above 4716 (bullish clue if we get there). With heavy close aka close that happens in the 90% percentile of the daily range, this is a bullish clue. Overnight we have built value above yesterday’s close, inventory is long (bullish clue). Let’s summarize.
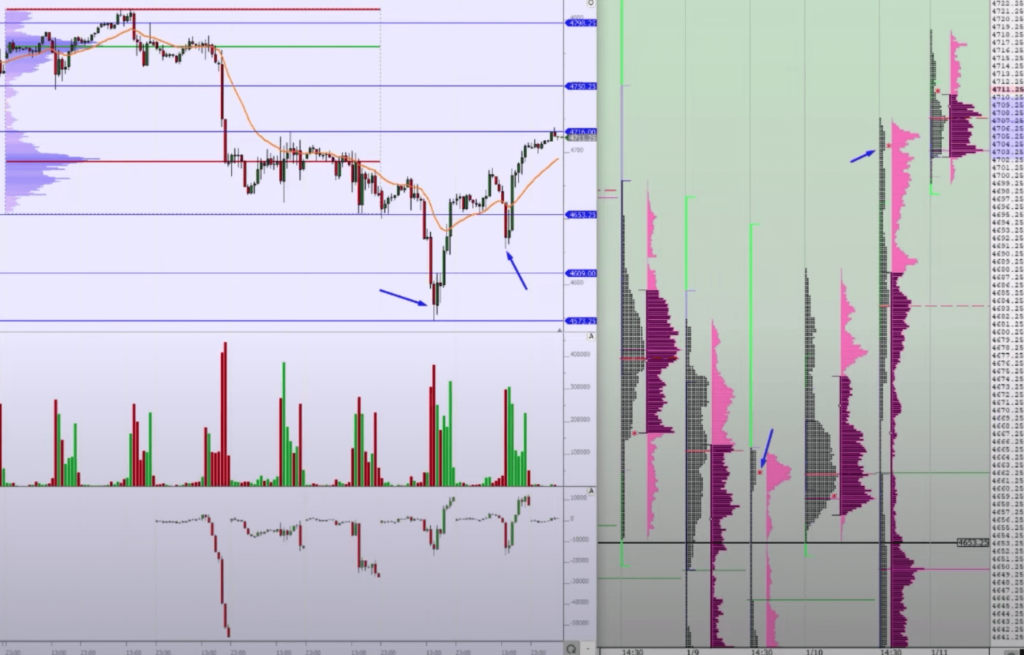
- Clue list
- Option Expiry Week (neutral – tailwind)
- Tails and V shape reversals (bullish)
- Cave above the current high (bullish)
- Yesterday heavy close (bullish)
- Overnight VA build above yesterday close – inventory long (bullish)
Primary scenario: as long as we can open and maintain value above the overnight low, this market is poisoned to knife through higher into the cave zone.
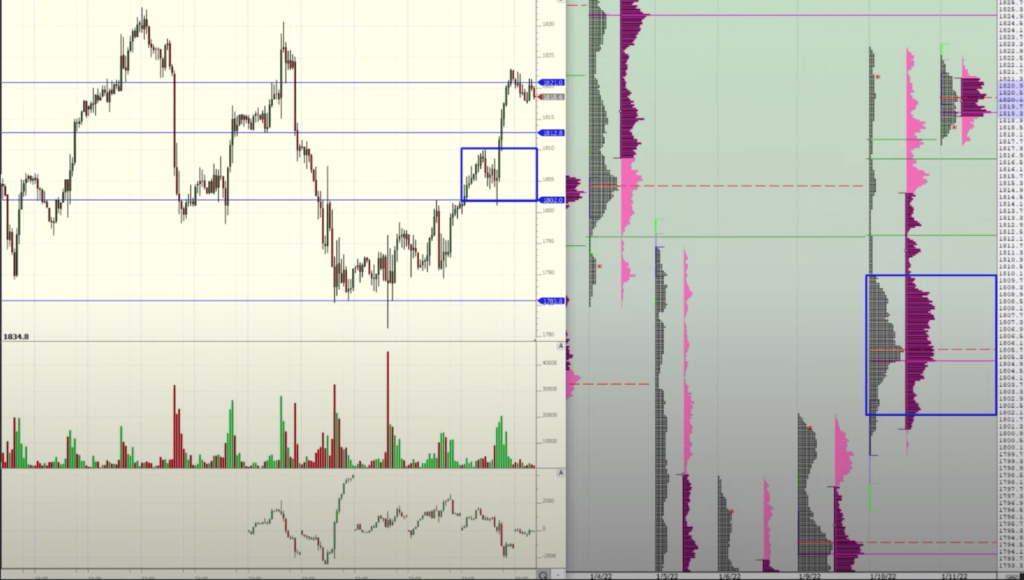
Now given the exercise we have just played with DAX, Bund, and S&P500, go and check the last Gold review here. Write down the clues. Document what you have observed in the video and how you can codify it for yourself and possibly build a strategy out of that.
Thanks for reading.
If you liked this type of content, you might check these videos as well:
- How To Manage & Exit A Failed Breakout Trade
- Sign Of A Breakout About To Fail – Price Ladder Trading
- Market Profile Trading: Better Breakouts with Context and Volume Profiling
Do you like what you have been reading? If you would like to improve your game, definitely check one of our courses that teach you all the techniques presented by AXIA traders from a market profile, footprint, or order-flow. If you are someone who likes to trade the news, we have a great central bank course. And if you are really serious about your future trading career, consider taking AXIA’s 6-Week Intensive High-Performance Trading Course.
Thanks for reading again and until next time, trade well.
JK