Use This Volume Pattern To Manage Your Trade – Introduction
In this article, we will discuss how to manage a breakout trade using a specific volume order-flow pattern. We will have a look at two order flow examples and identify key patterns that you could use to manage your trade. We will have a look at the DAX breakout trade that worked out and the EMINI S&P500 trade that failed. There will be one order flow pattern, that both trades share that can give you an early clue if you should stay in the trade. If you are interested in other volume order flow examples, don’t forget to check one of our previous articles: “Elite Trader Execution In The Bond Space”.
Trading Context
DAX Jump Breakout Pattern
In this trade example, we will be looking at the DAX trade. For the sake of the context, we know that DAX had a false break attempt higher and that is partially fueling the move down. Here is the chart of the DAX:
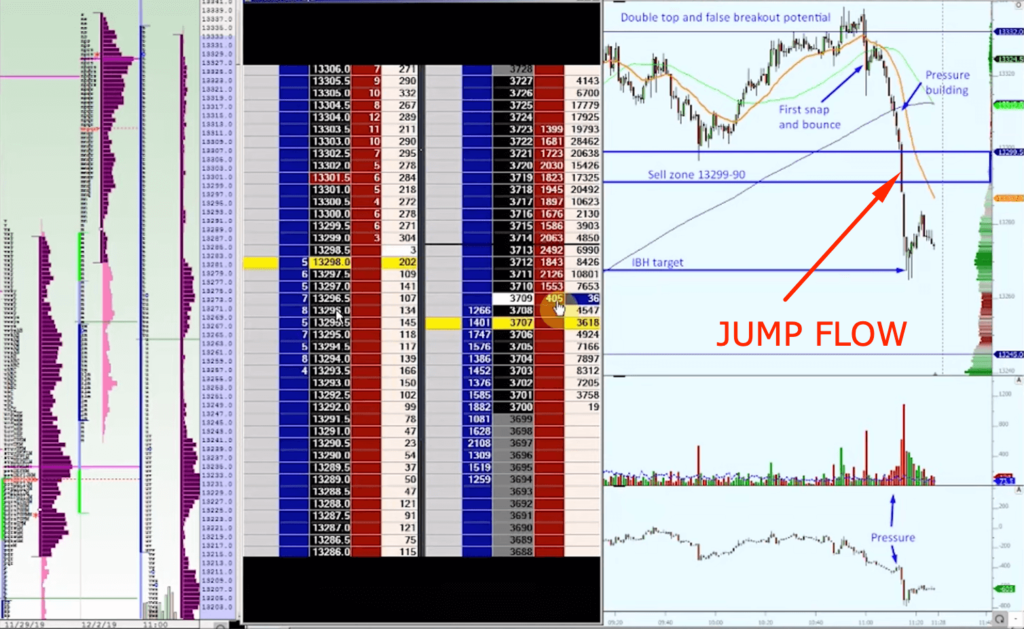
The P shape profile suggests there has been a positioning build that will require some unwinding. Short-term longs will have to cover as soon as we will be breaking 13299 zone.
Now to the one volume pattern, that is worth highlighting. We will call this pattern a Jump Flow pattern.
Jump Flow Price Ladder Pattern
The pattern I am about to describe is easy to spot, but there are a few nuances you need to be aware of. As the name suggests, this pattern is appearant by the “jump in the orderflow” on the price ladder (DOM), hence the Jump pattern. The key bit here is, that the space that got left behind (also called low volume node) won’t get traded back and there is the limited response from the other side. In essence what you want to see is:
- a jump on the price ladder
- happening at the key location (not just any location)
- with prior pressure built to support the move – in the DAX example the false range break and LH onetimeframing
- with low volume area left behind after the jump
- and very limited responsive action – in the DAX example, no strong buyers stepped in to lift the offer
That last bullet point is as crucial as the jump itself. In our DAX example, all bullet points can be checked and the market offered another 50 ticks lower the moment the jump order-flow pattern appeared.
Now, take this information and go test your skills if you can spot it. The video starts at 4:16 and within the next 15 seconds, you should spot this pattern.
EMINI S&P500 Jump Breakout Pattern
Now, let’s have a look at a different example but this time, the jump pattern fails. This time, you will recognize it since you have watched the DAX video, and this time you should know what to do.
Context first: EMINI S&P500, we have a level at 4380 that got tested multiple times last week, this week, and today with 220 lots traded. We are looking for a break, we have a catalyst behind us in form of news. What we are looking for now is “how the market will react to that level“. Effectively this is a poor high break and we are here to exploit this extreme with our volume jump strategy.
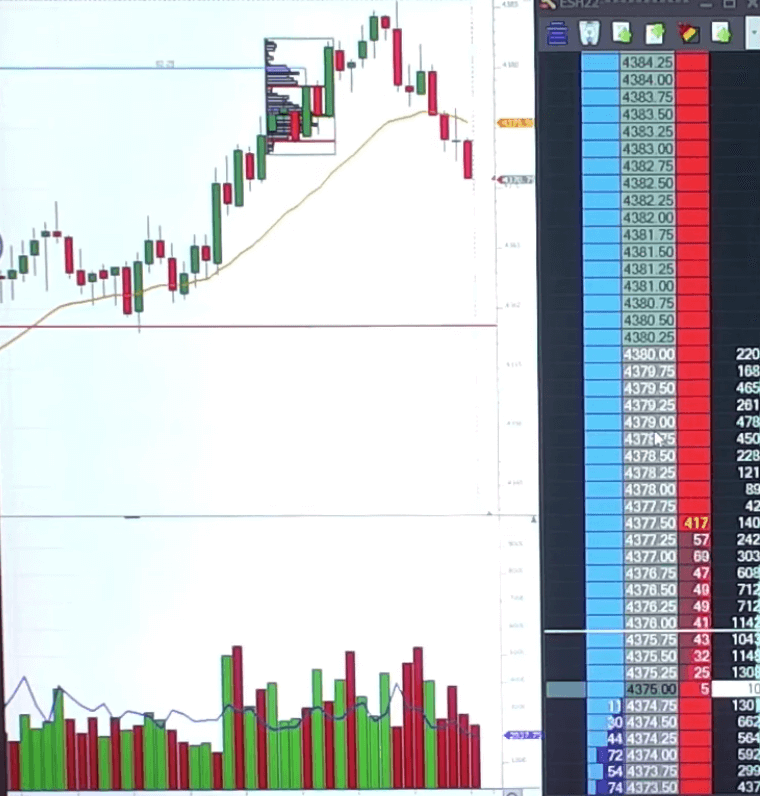
Now back to the order-flow. The moment we have jumped, we put in low volume area. The moment we did, we want to see the continuation and limited response from sellers. What do we get instead? The exact opposite. After a couple of minutes of stalling, we see responsive sellers filling the low-volume area. Another bad sign. This is a sign for us to get out. The trade has not worked out.
Now, go and check the video yourself. The video starts at 18:03. Identify all the points mentioned above and try to reflect on the difference between both trades. Both DAX and EMINI S&P500 shared the same pattern but produced different results. Break it down and learn from it. If you want to learn how Axia Traders trade other order-flow patterns, visit the free workshop we are running at: https://go.elitetraderworkshop.com/Free
PS: don’t jump into every jump pattern you see, be selective where you will put your money at risk
If you liked this type of content, you might check these videos as well:
- AXIA Junior Funded Trader Remains Composed After Missing Vaccine comment Live Trading
- AXIA Elite Trader trades Gilts & GBP On Bank of England Rate Decision
- AXIA Elite Trader Attacks 4 Markets On July 19 FOMC Rate Decision And Presser
If you like our content and would like to improve your game, definitely check one of our courses that teach you all the techniques presented by AXIA traders from a market profile, footprint, or order-flow. If you are someone who likes to trade the news, we have a great central bank course. And if you are really serious about your future trading career, consider taking AXIA’s 6-Week Intensive High-Performance Trading Course.
Thanks for reading and until next time, trade well.
JK