Stretched Volume Profile Strategy In Crypto Introduction
In this post, we will be focusing on stretched volume profile strategy in crypto. Using volume profile, we will identify the opportunity and then wait for the price action to confirm our access point. This type of trade is applicable to any type of market that got ahead of itself, got stretched outside of value, and is bound to be corrected. Of course, this ideally goes hand in hand with other confluence factors such as important resistances or the “tired” trend. Some of the similar factors we have discussed in our previous article: Elastic Band And VPOC Reversal Trading Strategy.
This article is based on the video down below.
Application Of Volume Profile In Crypto
We will be using the same tools, our regular readers are familiar with. This is all about volume profile and price action. We look at two examples using BTC futures and then we will jump into TradingView and replicate the same concept.
First, let’s start with the concept of value and logic behind this trade. This trade is all about those people who jumped into the rapidly rising prices and accepted that higher price. The edge in this trade is that the price change was so rapid, that not enough value has been built up yet. From auction market theory a low volume area is created and the market will search for value through price discovery. Yes, the market can continue higher, but if fewer and fewer participants are willing to participate at higher prices, the market will soon seek the value lower until it finds the fairest price. This is ideal for us because it gives us:
- reason to enter (stretched profile)
- access point (failure pattern)
- target (last value area)
Let’s break down this trade.
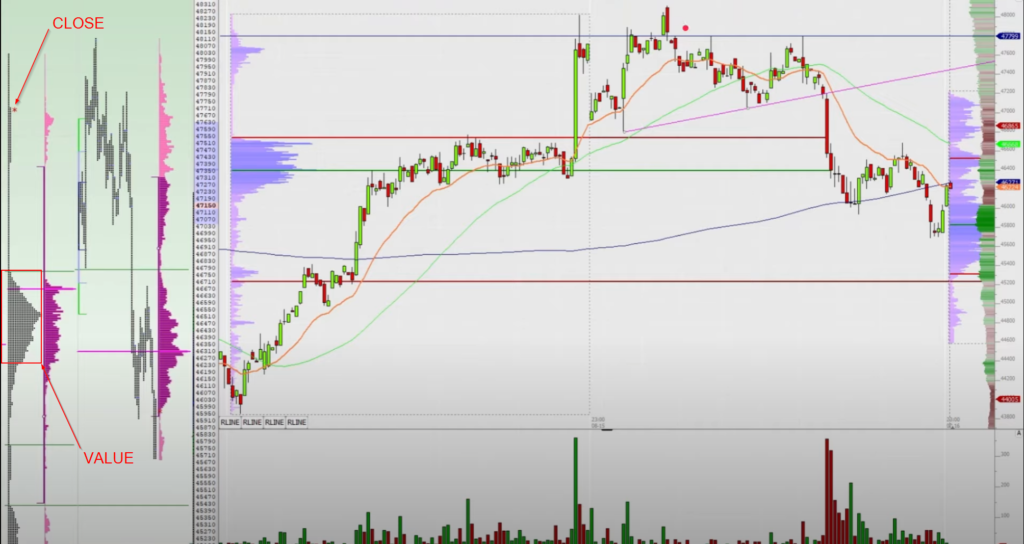
On the image above you can see two charts. The one on the left is a volume profile. We can see the value area lower and the closing price higher. It is clear that much less volume was transacted higher near the “closing” price. This is how we spot our pattern. An imbalance between value and close has been created. Now it is all about what will happen next at the higher prices.
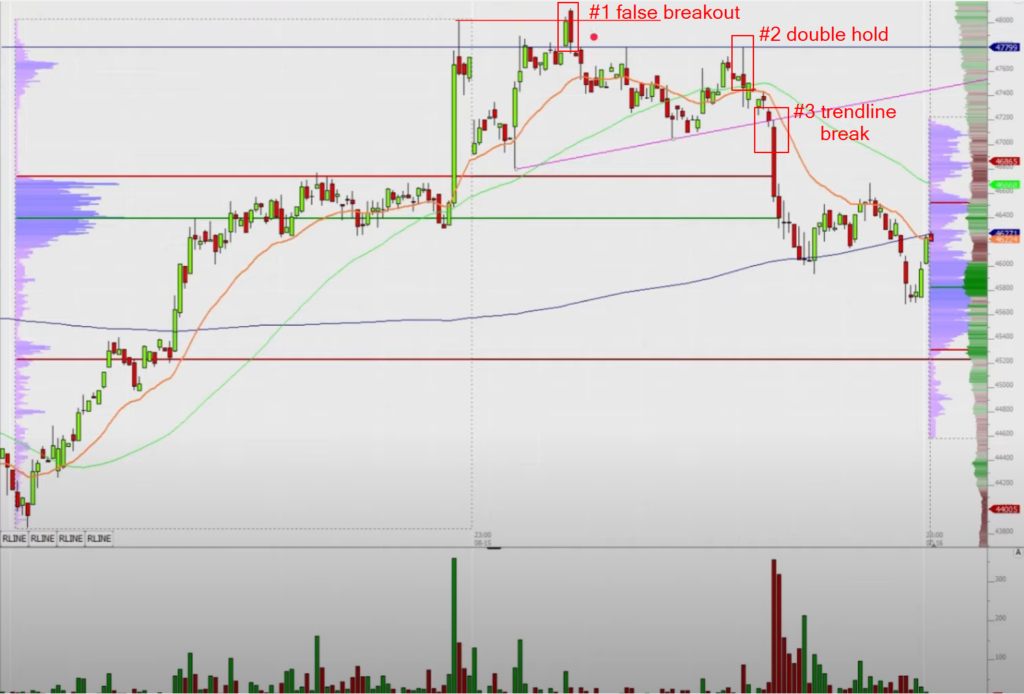
Now it is all about how the higher prices will be accepted. Of course, we have multiple options to look for in this acceptance or rejection but the one I like the most is the actual failure to break higher above the stretched profile. This comes as #1 on the chart above. This is a signal, that market does not want to accept higher prices and can signal a reversal back towards the previous value area (our target). There are other ways how to access this trade after the reversal signal such as #2 double hold and #3 trendline break.
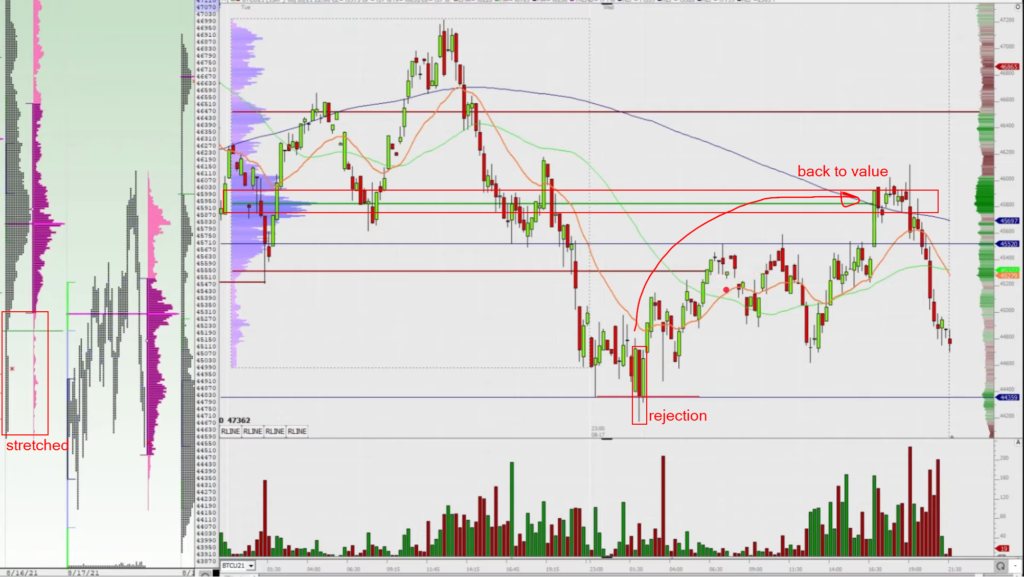
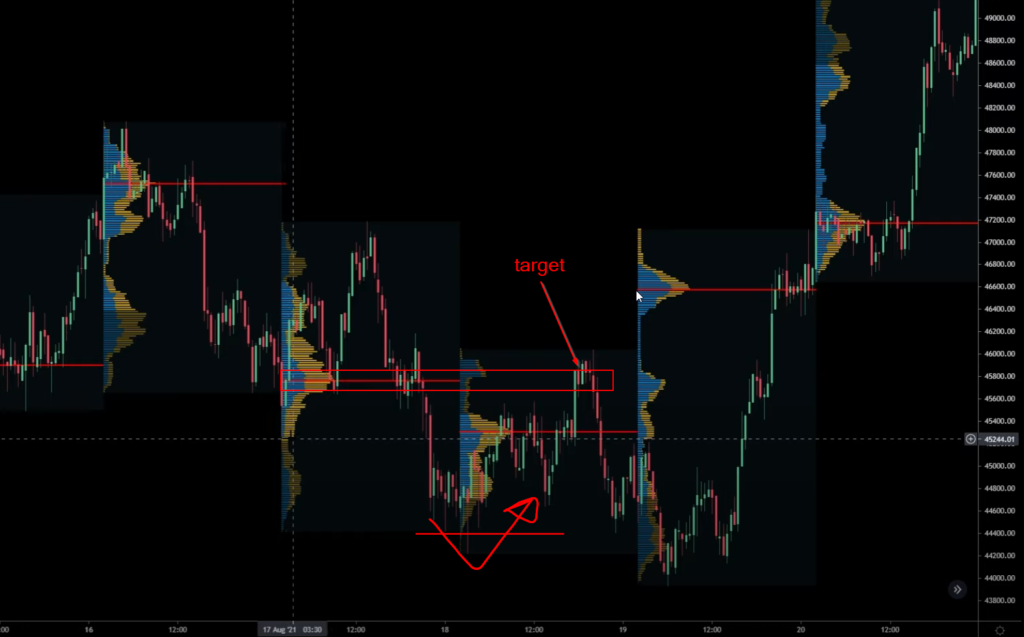
Here is a similar example. The only difference is that this time we are going long and the trade took a bit more time to reach the target. But the concept was the same:
- Stretched Profile
- Failure to accept lower prices
- Return back to value
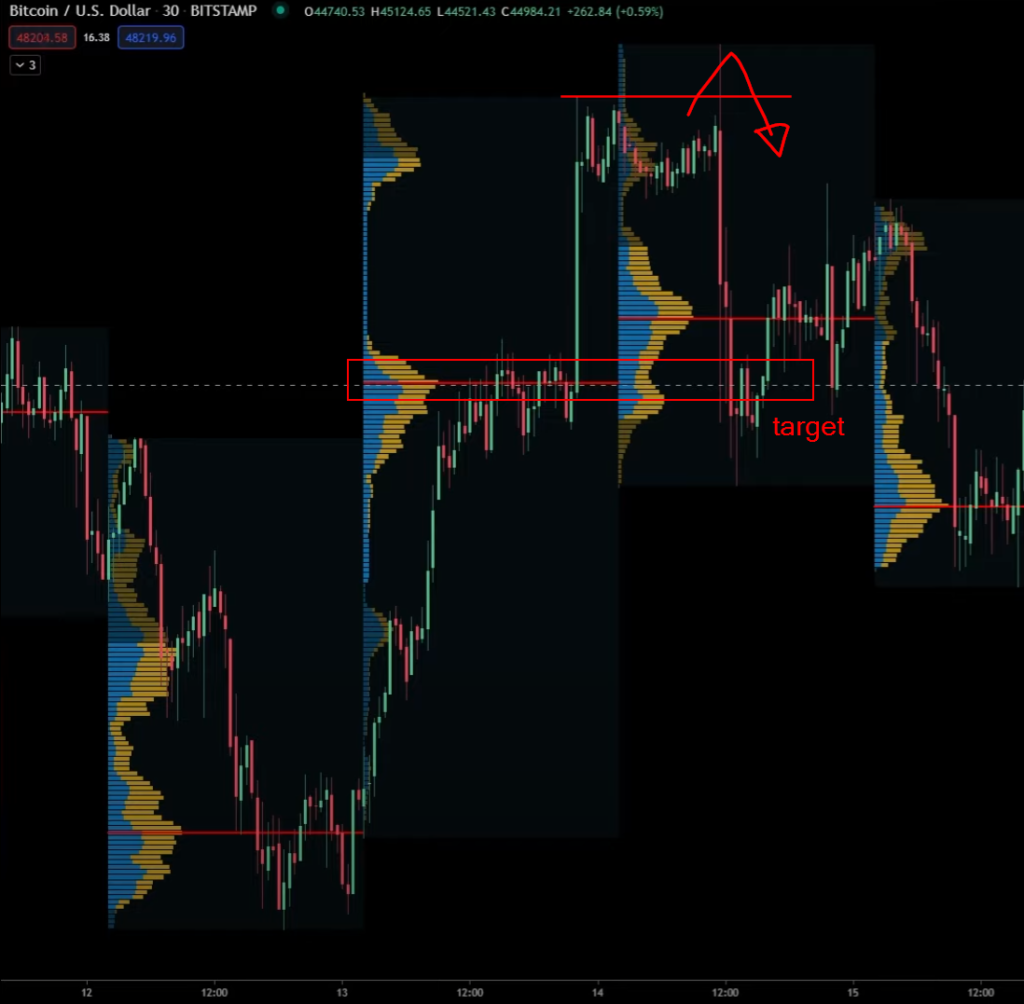
Since we understand a lot of people are using TradingView, you can use a volume profile tool in the TradingView called Session Volume. Here is how the same opportunity looked like in the TradingView for the first example.
And here is the second example.
If you would like to learn about these concepts, don’t forget to check our Free Workshop at https://go.elitetraderworkshop.com/Free.
If you liked this article, you might check these videos as well:
- 3 Types Of Price Level Breakout Trading
- Sign Of A Breakout About To Fail – Price Ladder Trading
- Market Profile Trading: Better Breakouts with Context and Volume Profiling
And if you like our content and would like to improve your game, definitely check one of our courses that teach you all the techniques presented by AXIA traders from a market profile, footprint, or order-flow. If you are someone who likes to trade the news, we have a great central bank course. And if you are really serious about your future trading career, consider taking AXIA’s 6-Week Intensive High-Performance Trading Course.
Thanks for reading and until next time, trade well.
JK