How To Trade Iceberg Using A Price Ladder Introduction
In this article, we will review how to trade an iceberg using a price ladder. We will do a breakdown of two examples in Oil and EMINI S&P500. Both executions described below are about a break through the iceberg. What has happened just prior to breaking the iceberg and seconds after we broke the iceberg. The latter is very important because it can present you with a very nice scalp opportunity and well-defined risk that we will try to break down for you. If you would like to find out more about other price ladder techniques, check out our previous post about a JUMP trade price ladder strategy.
Trading The Iceberg
What Is An Iceberg?
Before we jump into the actual explanation of the trade strategy, let’s briefly discuss what an iceberg is. In a nutshell, an iceberg is a specific price level where large absorption of volume happens. This large trade is usually done by bigger, possibly institution players, that simply have a large trade to execute and have decided for a specific price to do so.
Choosing an iceberg strategy for the execution does not show all the cards straight away so it is not obvious from the price ladder at the first sight. And that is where we ,intraday traders, come in to utilize the power of price ladder.
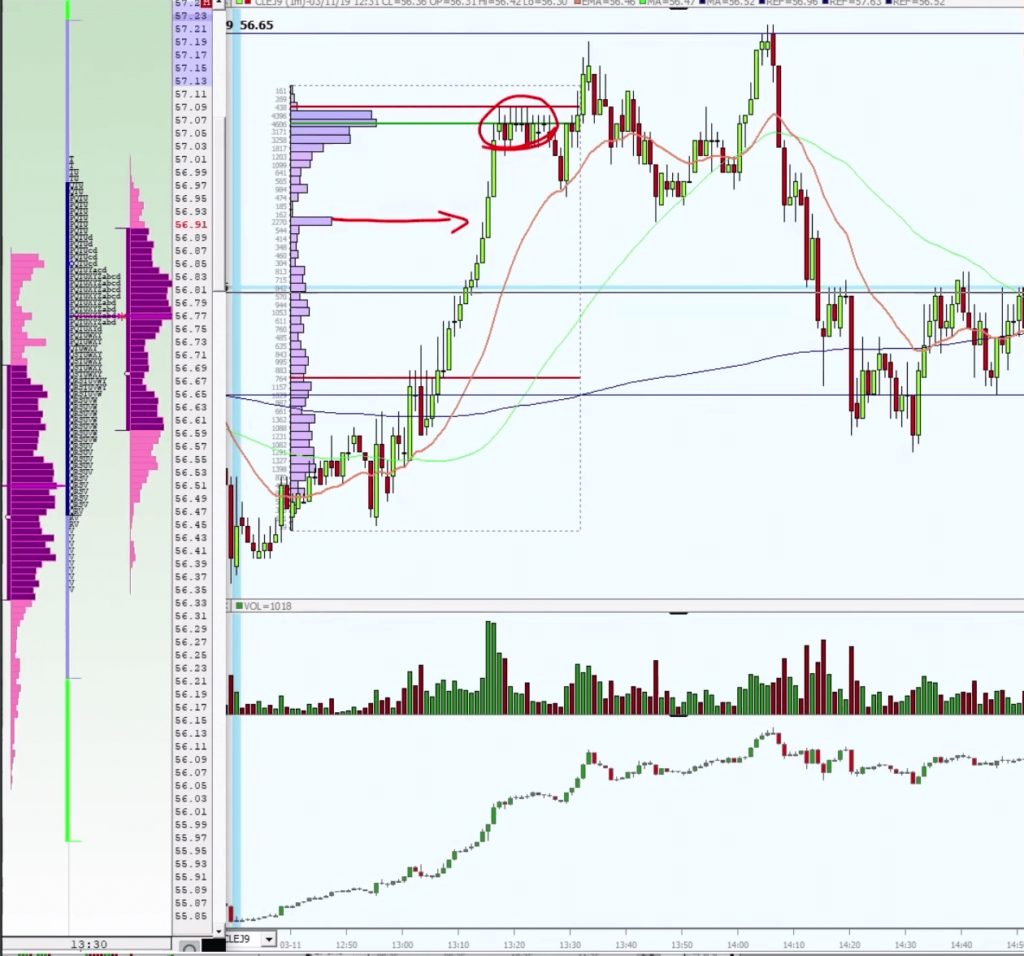
Trading Iceberg In Oil
Let’s start with an example from Oil. Market bid in the afternoon only to get to 73 level. There was very little chance you could have a picked 73 level for a place where the market would find resistance. As we were approaching 73, we can see there is large absorption happening there. A chance for an iceberg.
Given the pace with which we are approaching an iceberg, we should act quickly. The moment the iceberg will go, we should jump in. We can either use stop market order, hit the market the moment iceberg breaks or lay down the bids after the break (like Richard did in this example). It is all about what happens in the next few seconds after iceberg breaks. That is our scalp opportunity. Let’s break it down.
Watch the trade from here and ask yourself what you have seen seconds after we broke through 73. Here are some questions to ask yourself seconds after the iceberg breaks:
- what is the pace after we broke the iceberg? Same / Increased / Decreased?
- what does the change in pace mean?
- did the JUMP price action on the price ladder happen?
- was the LVN created after we broke the iceberg?
- after we broke the iceberg, have selling increased?
- is buying still persistent after the break?
We can see that the pace is the same and slightly increased (good), LVN was left behind by JUMP(good), no selling increased (good), and we got sticky bid/buying is still persistent (good). We have a clear invalidation point below 73 and we can hold the trade as long as the pace and LVN left behind hold.
Good trade.
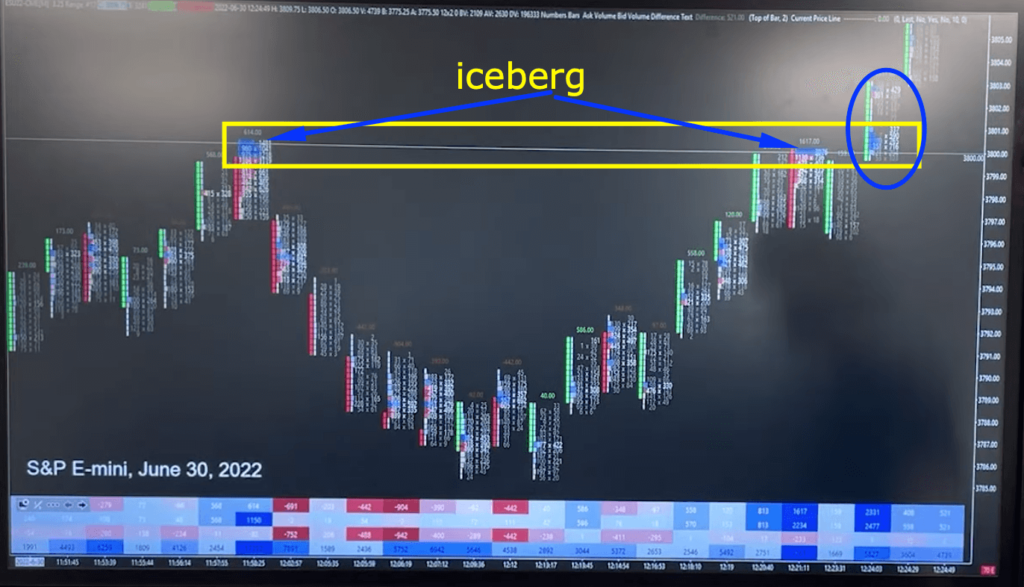
Trading Iceberg In EMINI S&P500
Let’s zoom in on the EMINI S&P500 iceberg trade example. In this case, an iceberg was spotted at the 00 level (see footprint down below) and created an opportunity for an iceberg breakout.
Since we are focusing only on the breakout of the iceberg I want you to revisit the Oil trade and apply these questions:
- where would you enter the trade?
- what would you want to see prior to and after the break?
- what would invalidate your trade?
Although we don’t have a recording of the price ladder, we can identify that LVN and JUMP were clearly present judging by the footprint chart (see blue circle). The market did not get back below the iceberg price and run higher after the break. Again, a well-defined opportunity with a clear invalidation price.
If you want to learn how Axia Traders trade other price ladder patterns, visit the free workshop we are running at: https://go.elitetraderworkshop.com/Free
If you liked this type of content, you might check these videos as well:
- How to Start Using Footprint Charts | Axia Futures
- How To Become A Better Trader | Axia Futures
- What Really Good Footprint Action Looks Like | Axia Futures
If you like our content and would like to improve your game, definitely check one of our courses that teach you all the techniques presented by AXIA traders from a market profile, footprint, or order-flow. If you are someone who likes to trade the news, we have a great central bank course. And if you are really serious about your future trading career, consider taking AXIA’s 6-Week Intensive High-Performance Trading Course.
Thanks for reading and until next time, trade well.
JK