500 Lots Trading Mistake Introduction
In this blog post, we will have a look at 500 lots trading mistake. What can turn the A setup into the A+ setup? An unusual activity that we don’t see every day such as 500 lots entering the market at the point, where it really matters! Read this article and find out how trader Harry breaks down his breakout trade in Gold and explains, how two seconds can make a difference between making great and mediocre trade.
This article is based on the video down below.
Breaking Down The Trade
High-Level Trading View
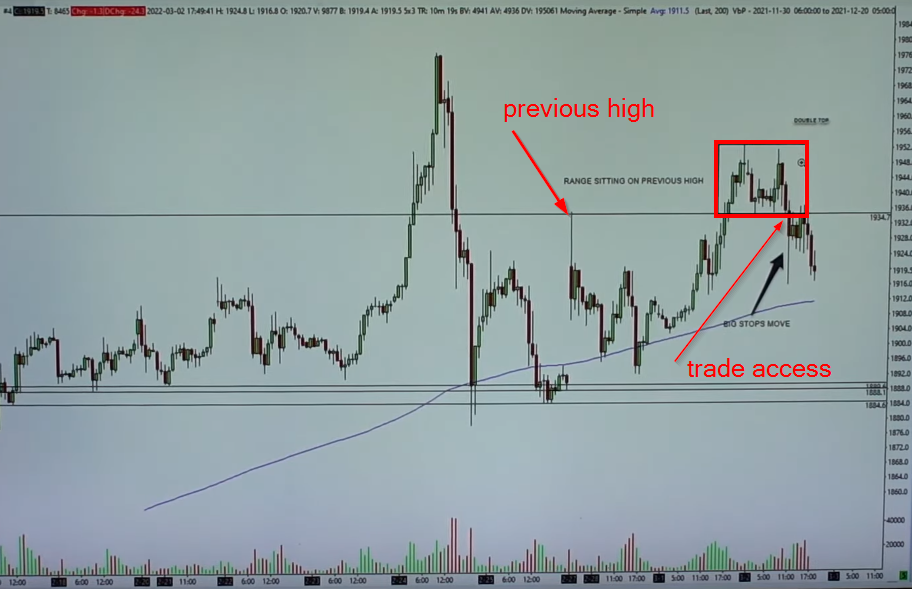
Starting from a high-level view, we are looking at the chart of Gold. After breaking the high that was formed after the big tail reversal, we have built a range above this high (see red box). Overall this is a bullish sign, but the big picture positioning is clearly skewed to the upside. Therefore breaking down of the range might trigger a fast unwinding of the longs.
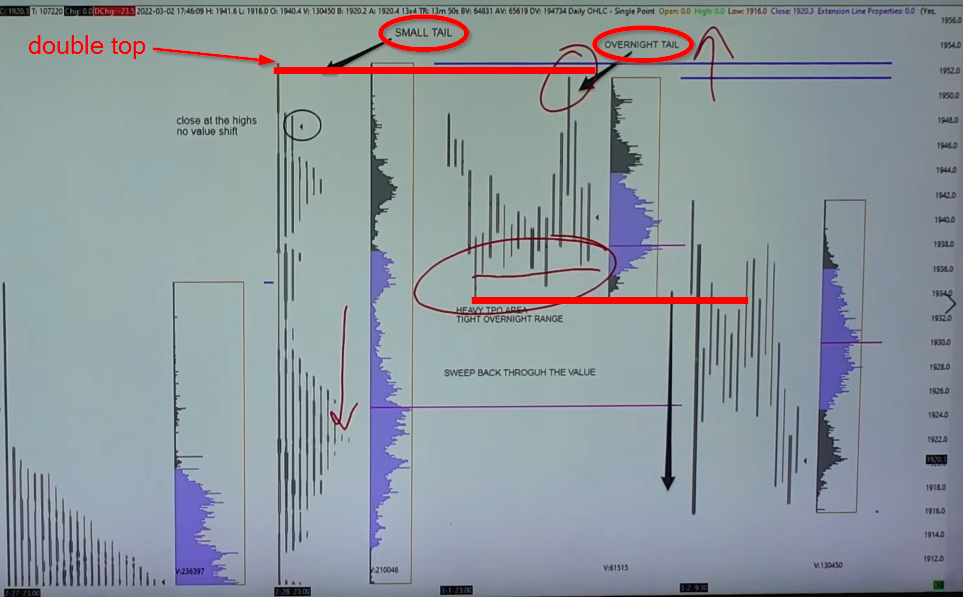
Looking at the market profile chart, we can see two tails. One small tail the previous day and one overnight tail. This suggests that in the shorter time frame sellers are in control of these prices. The short-term skew is to the downside with bigger picture upside positioning.
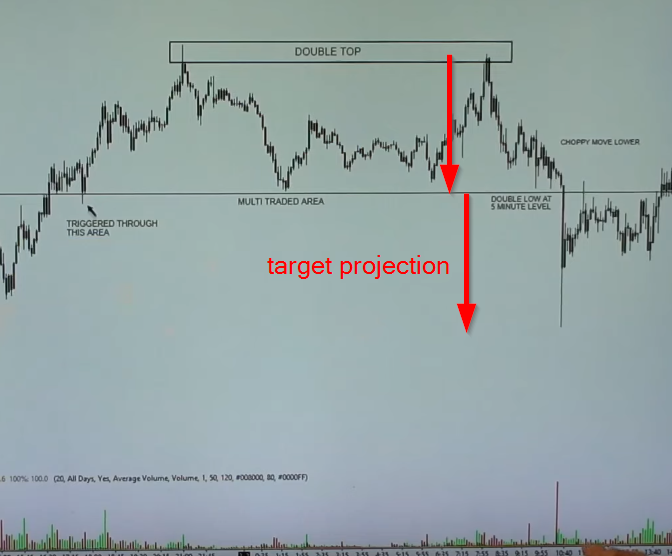
In terms of projecting range for a target, we are looking at the equal distance of the double top range. We have a clear target set by the range.
We are trading Gold so we are aware, that Gold has a tendency to go for over-extended moves from time to time thanks to stops being triggered and the thin nature of the tape.
500 Lots Trading Execution
Now it is all about the execution. The key question with a breakout is to know when to hit it. You can try multiple times and fail. There are several clues to look for:
- energy build-up – has there been enough intraday positioning built prior to the break?
- breaking volume – are we breaking on an increased volume?
- velocity/pace increase – has the velocity increased, the pace changed?
- large orders in the opposite direction – don’t produce the anticipated move
- large orders in the direction of your move chase price – such as 500 lot chasing prices down
If you want to find out, how to recognize price ladder personality shift, enter trades based on the price ladder, and exit trades ahead of the crowd for the best possible price, join us at the free webinar we are running at: https://www.elitetraderworkshop.com.
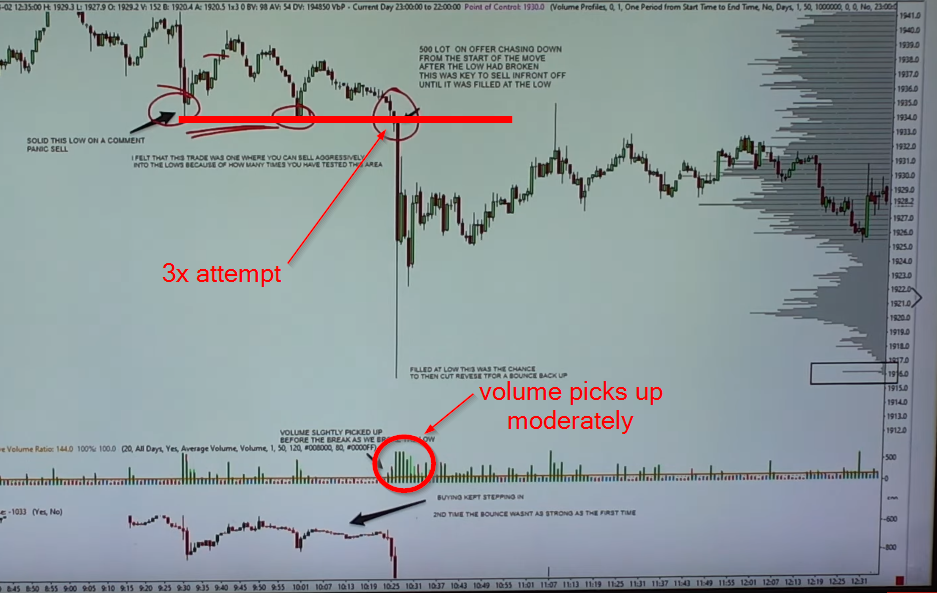
Now if you have looked at the recording of the price ladder that starts at 11:31, you can see most of the points described above in the list. You can see volume increase, pace change, 50lots lifted and nothing happens, and most importantly, 500 lots coming to the offer and chasing. That is your moment, that is where you have to push hard with your size.
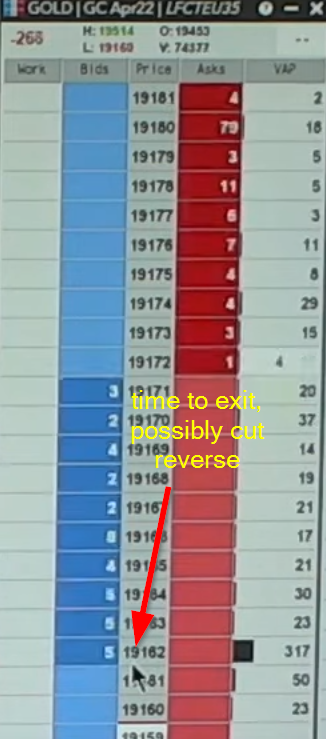
And exit? There was someone absorbing the bid with 317 lots. For one second you had a chance to exit your position and possibly cut and reverse.
Thanks for reading.
If you liked this type of content, you might check these videos as well:
- How To Manage & Exit A Failed Breakout Trade
- Sign Of A Breakout About To Fail – Price Ladder Trading
- Market Profile Trading: Better Breakouts with Context and Volume Profiling
Do you like what you have been reading? If you would like to improve your game, definitely check one of our courses that teach you all the techniques presented by AXIA traders from a market profile, footprint, or order-flow. If you are someone who likes to trade the news, we have a great central bank course. And if you are really serious about your future trading career, consider taking AXIA’s 6-Week Intensive High-Performance Trading Course.
Thanks for reading again and until next time, trade well.
JK


