Trading The Shooting Star Candlestick With Market Profile Introduction
In this blog post, we will look at trading the shooting star candlestick with market profile. This was the trade taken by Isaac and he explains his thought process executing this type of trade. A lot of the times traders ask us what are the best tools to start with. Should you start with candlesticks or market profile? Price ladder or Footprint? All these techniques are just tools and their combination gives you insight into the psychology of the market, not the edge. What gives you the edge is the execution of all moving parts including your psychology. In this particular case, Isaac breaks down how understanding the shooting star insights from the market profile point of view, can give you an advantage in understanding if this is the right shooting star to sell. If you like the concept of combining market profile a standard technical analysis into executable strategy, don’t forget to check our previous blog post Scalping Reversal Strategy Of Trapped Market Participants
This article is based on the video down below.
If you are interested in videos like this, watch the full video on a free two-week trial at https://www.AxiaFutures.com/
Shooting Star Trading Context
Introduction
In our analysis, we will be using several tools. We will start the analysis with a daily view of the candlestick chart. On the candlestick chart, we have identified a shooting star pattern. This pattern in our context (market trending higher) can provide an insight that the market might at least temporarily move lower. But using just a candlestick is not enough. We want to understand two main angles of the trade:
- How was the previous move created that preceded the formation of a shooting star?
- How was the actual shooting start constructed from the market profile view?
Trading Clues Derived From Trading The Shooting Star
To answer the questions above, we will start with understanding how was the preceding move created prior to the shooting star.
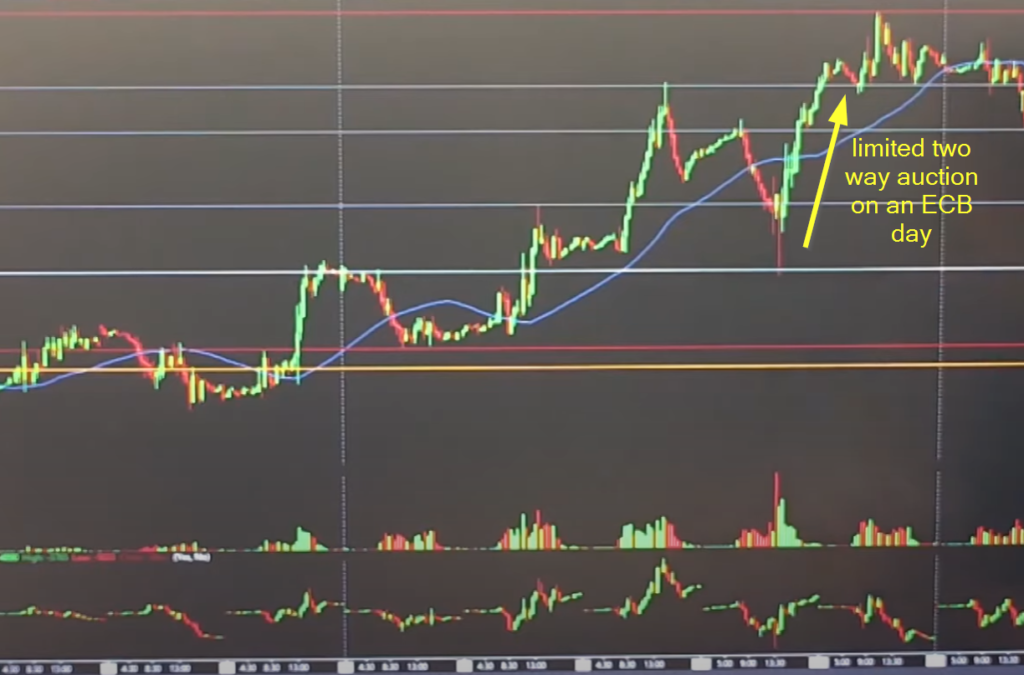
The first clue is understanding how the move was created. By looking at the structure, we can see that the chart lacks a two-way auctioning process. A process that tells us, that both sides participated. In this case, we can see that sellers were willing to accept higher prices without much resistance. This creates a possible clue for us in the future in the form of a weak structure that will be more “easily” auctioned back. This move happened on the ECB day where more emotions were driving the market than the usual day.
Now let’s have a look at the daily context.
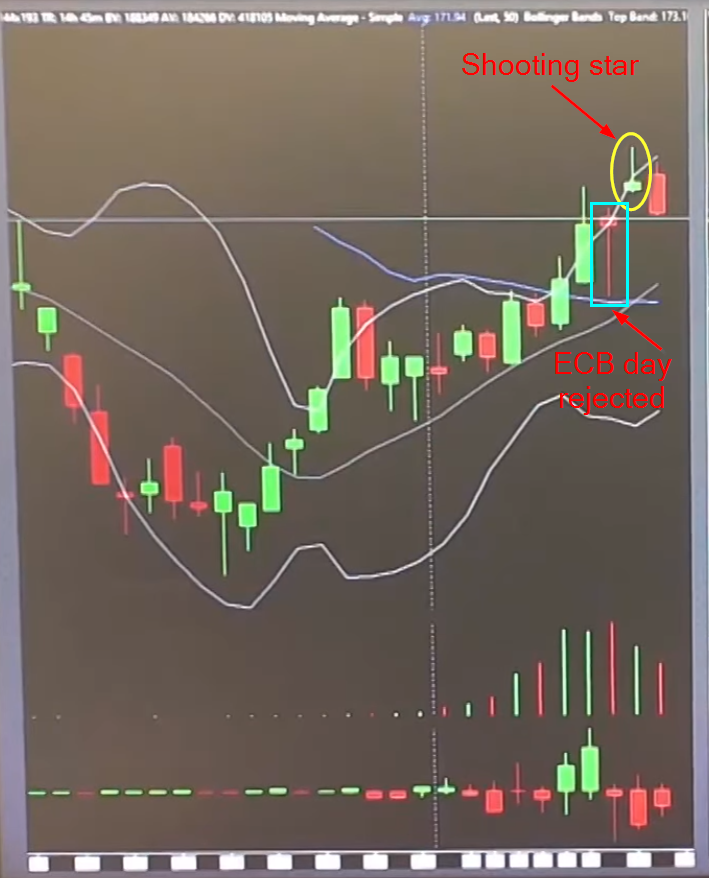
As we can see from the image above, a shooting star has been formed after the ECB day. We now want to look at the structure from the market profile point of view.
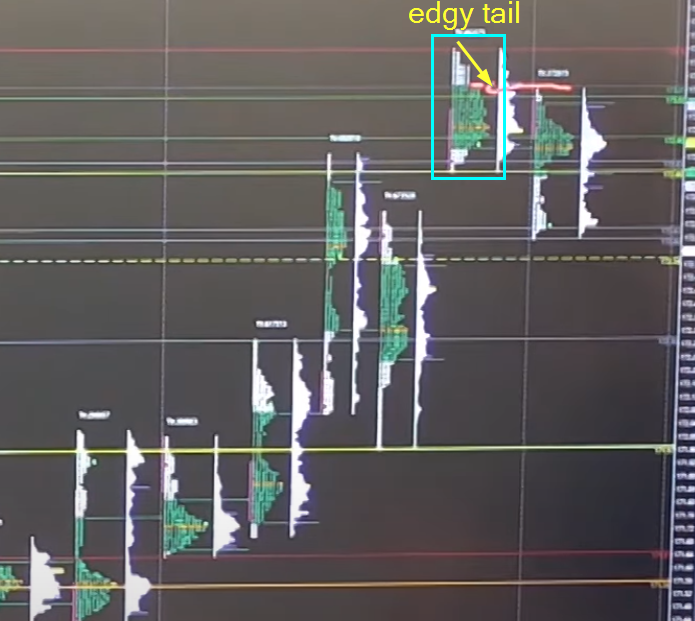
From the market profile picture we can see that:
- market gapped higher
- market moved higher but created an “edgy tail” at the highs that resulted in the shooting star formation – this means a form of responsive selling where buying participation was not ideal
Moving onto the next day, the market opened in value area and in range. After that, the market started to build this balanced to b shape intraday, which signals again responsive selling pressure and bearish imbalance at the lows. This results in a bearish skew and our signal to aim the “sell the Bund” idea.
Executing On The Shooting Star Idea
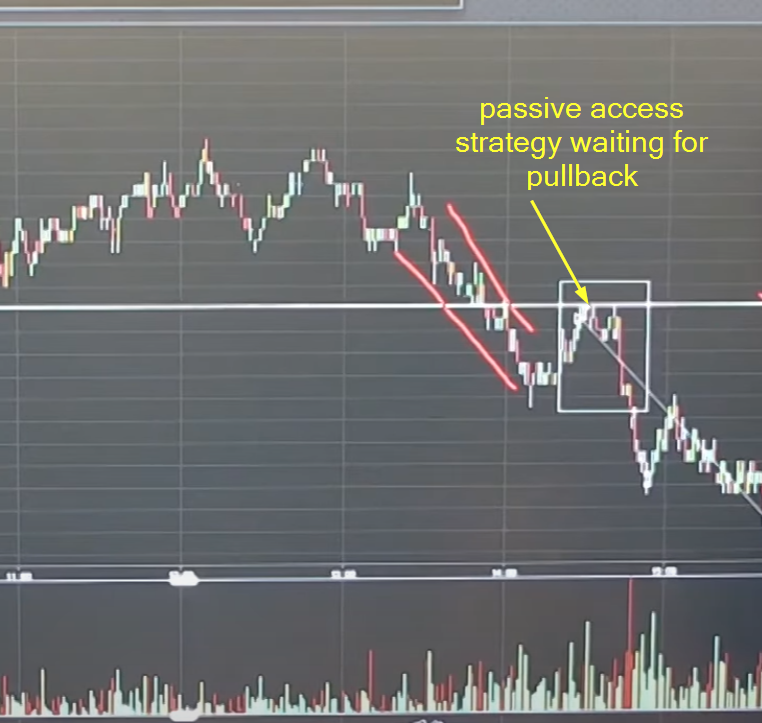
With all clues coming together, Isaac has chosen to execute this idea with the passive pullback access strategy. Why? His reasoning was, that all the people who were trapped and long, will look for the best location to exit their position, and it would be a good opportunity to seek absorption and a short trade at this location.
Key Trading Takeaway
Are you interested in insights that market profile can give you? Check out how professionals use their tools such as market profile that has been used in this analysis. The main lesson from this post is the combination of clues that led to this trade. Highlights such as poor structure prior to shooting star day, edgy tail, and responsive selling that created bearish imbalance were all small telling signs.
Thanks for reading.
If you liked this type of content, you might check these videos as well:
- How To Manage & Exit A Failed Breakout Trade
- Sign Of A Breakout About To Fail – Price Ladder Trading
- Market Profile Trading: Better Breakouts with Context and Volume Profiling
If you like our content and would like to improve your game, definitely check one of our courses that teach you all the techniques presented by AXIA traders from a market profile, footprint, or order-flow. If you are someone who likes to trade the news, we have a great central bank course. And if you are really serious about your future trading career, consider taking AXIA’s 6-Week Intensive High-Performance Trading Course.
Thanks for reading again and until next time, trade well.
JK