
Supplementary Materials
Chapter 9: The Engineer — Part I
Prepared to Support Readers of Traders of Our Time: Navigating the Market’s Impossible Landscape
S&P 500 (ESM25 — CME) Market Profiles in March ’25
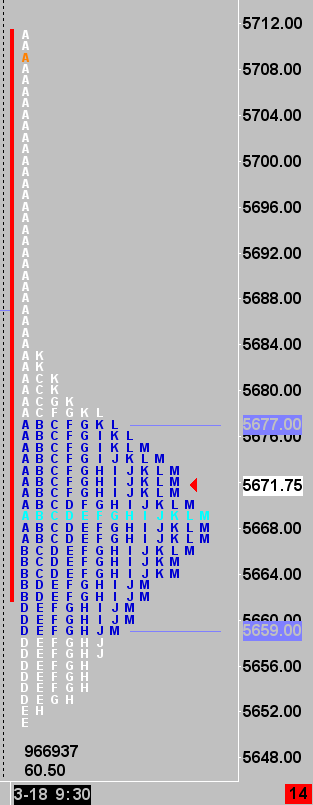
The market opened at the ‘A print’ (orange), roughly at 5708, and auctioned lower. Each TPO/letter is printed in 30-minute increments. With the exception of the tail, the later trading in the day settled into a profile resembling a ‘normal distribution’ or bell curve. (Date: 18th March 2025).
All other profile charts are variations of this, depending on participation, volatility, and other factors.
(Note: Usually, there is one tick per letter increment, but for clarity, this chart displays four ticks (one handle) per letter. The profile chart displays only the underlying cash market hours: 09:30–16:00 EST/EDT, New York time. Chart rendered by Sierra Chart.)
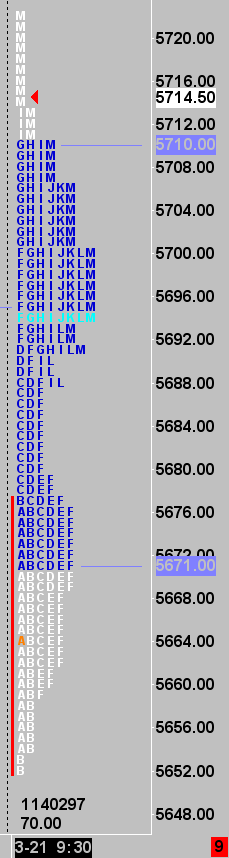
The market opened at the ‘A print’ (orange), roughly at 5664, and distributed around this price before auctioning higher to form another distribution, closing towards the high (M session / red arrowhead). Something changed to spur initiative-taking buyers. Many times, this type of day is referred to as a ‘double distribution’, though there are variations of it. (Date: 21st March 2025).
(Note: Usually, there is one tick per letter increment, but for clarity, this chart displays four ticks (one handle) per letter. The profile chart displays only the underlying cash market hours: 09:30–16:00 EST/EDT, New York time. Chart rendered by Sierra Chart.)
Bund (FGBLM25 — EUREX) Market Profiles in March ‘25
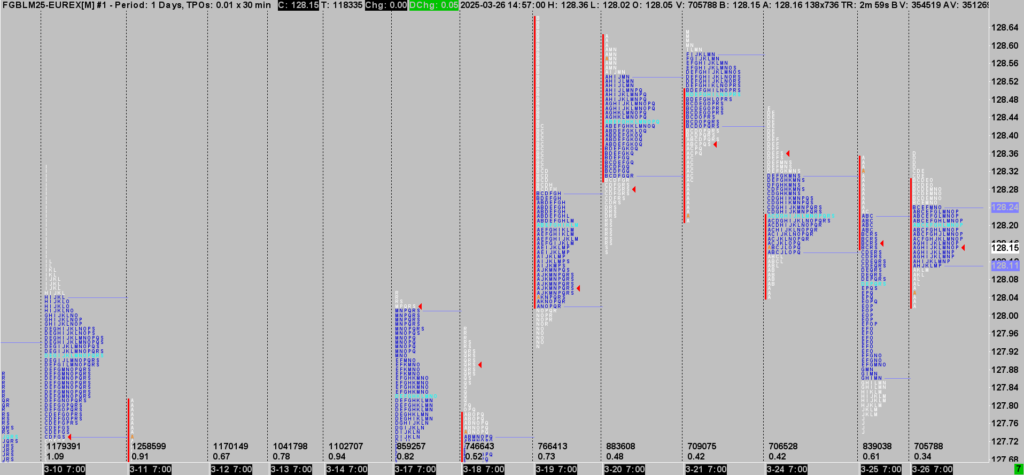
A series of Market Profiles spread over multiple days. Contextual volatility has compressed over the past weeks — shifting from larger ranges to smaller daily ranges.
- Notice the “blocky” appearance of the profile to the downside on 25th March (3-25).
- In contrast, compare this with the pronounced selling tail observed on 19th March (3-19).
(The profile chart displays only the underlying cash bond market hours: 07:00–16:30, London time. Chart rendered by Sierra Chart.)
EURO STOXX 50 (FESXM25 — EUREX) Market Profiles in March ’25
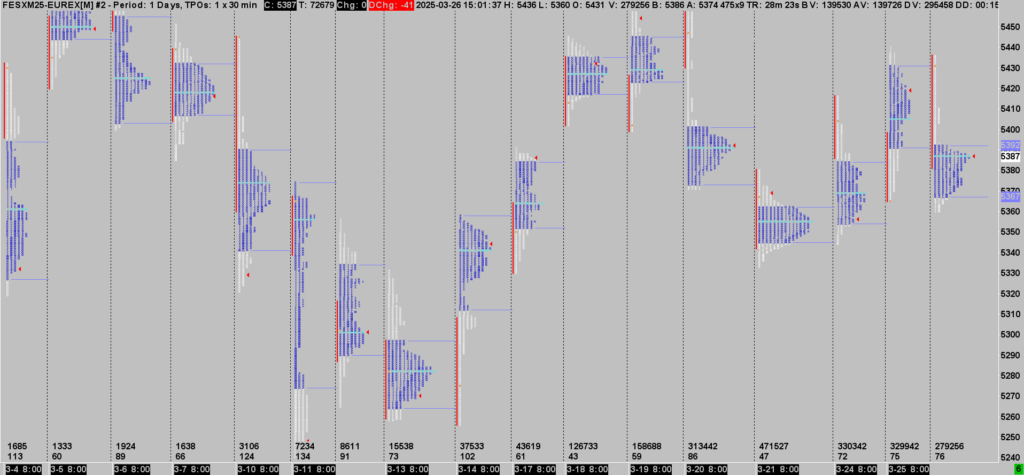
A series of market profiles spread over several sessions.
- Notice variations of a ‘normal distribution’ (bell-curve)–looking profile on 7th March (3-7), 18th March (3-18), and 21st March (3-21), suggesting there was not much business to be done. (What kind of order flow would feature in this ‘container’?)
- Compare a very mangled, blocky, “unhealthy auction”–looking profile on 17th March (3-17) with 10th March (3-10), which featured more initiative-taking activity, then later two-way flow — closer to a more normal or healthy auction.
(The profile chart displays only the underlying cash market hours: 08:00–16:30, London time. Chart rendered by Sierra Chart.)
WTI Crude Oil (CLK25, J & H— NYMEX) Market Profiles in Feb-March ’25
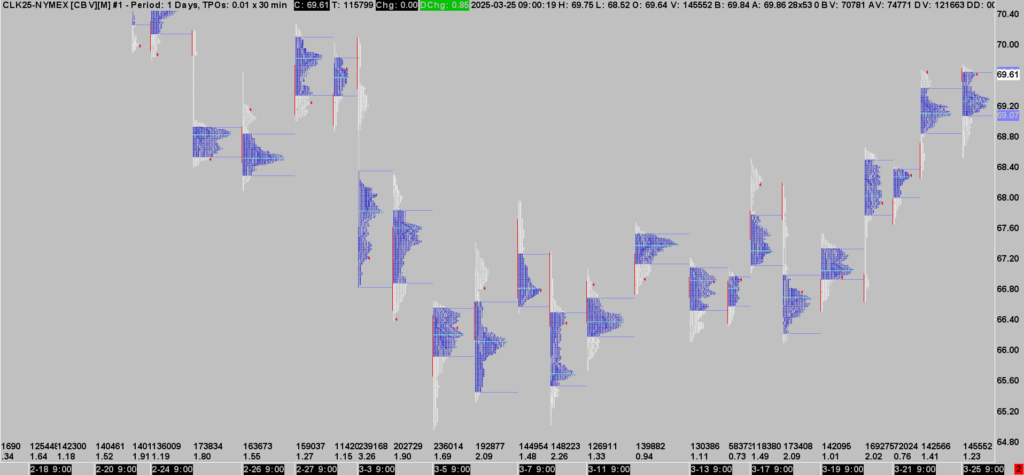
This series of 24-hour daily market profiles is intended as an instructional tool to highlight various auction activities and the twists and turns in order flow, creating skews in the profile or distribution. Order flow within different profile ‘containers’ — as investigated in Traders of Our Time — will be radically different.
(Note: Back-adjusted chart. This is a 24-hour chart, not session-split, with the new day ticking over at the 9 a.m. EST NYMEX cash open. Chart rendered by Sierra Chart.)
Watch: Analysis of The Engineer’s Use of the Market Profile in Two EuroStoxx (FESX) Trades
In both videos consider: How the immediacy of the price ladder is being tied to the strategic use of the market profile.